2025 Diamond Market Report


Executive Summary
2025 was the year policy became a market force. Tariffs did not just add cost, they changed how the trade managed risk, where inventory was located, and how fast prices reset when conditions shifted. The market moved in bursts, with long pauses followed by quick repricing as the industry adjusted to new trade terms and uncertainty.
One of the clearest signals of that shift was the widening gap between global pricing and stones already located in the United States. As tariff pressure increased, US-positioned inventory consistently traded with more stability than goods outside the US, because even when replacement stones were cheaper in manufacturing centers, the cost of bringing them into the US was too high, which kept stateside pricing firmer.
In the manufacturing centres, Natural diamonds weakened, but the story was not one straight decline. Smaller Round goods absorbed most of the pressure once supply returned, while larger stones held steadier and became the market’s anchor. Lab-Grown followed a different playbook. With virtually unlimited production capacity and constant availability, pricing kept stepping down across the market as competition stayed intense.
For buyers and suppliers alike, 2025 rewarded clarity and speed under shifting trade terms, knowing what you are buying or selling, where it sits, and what friction is attached to moving it.
The 2025 Market Lens
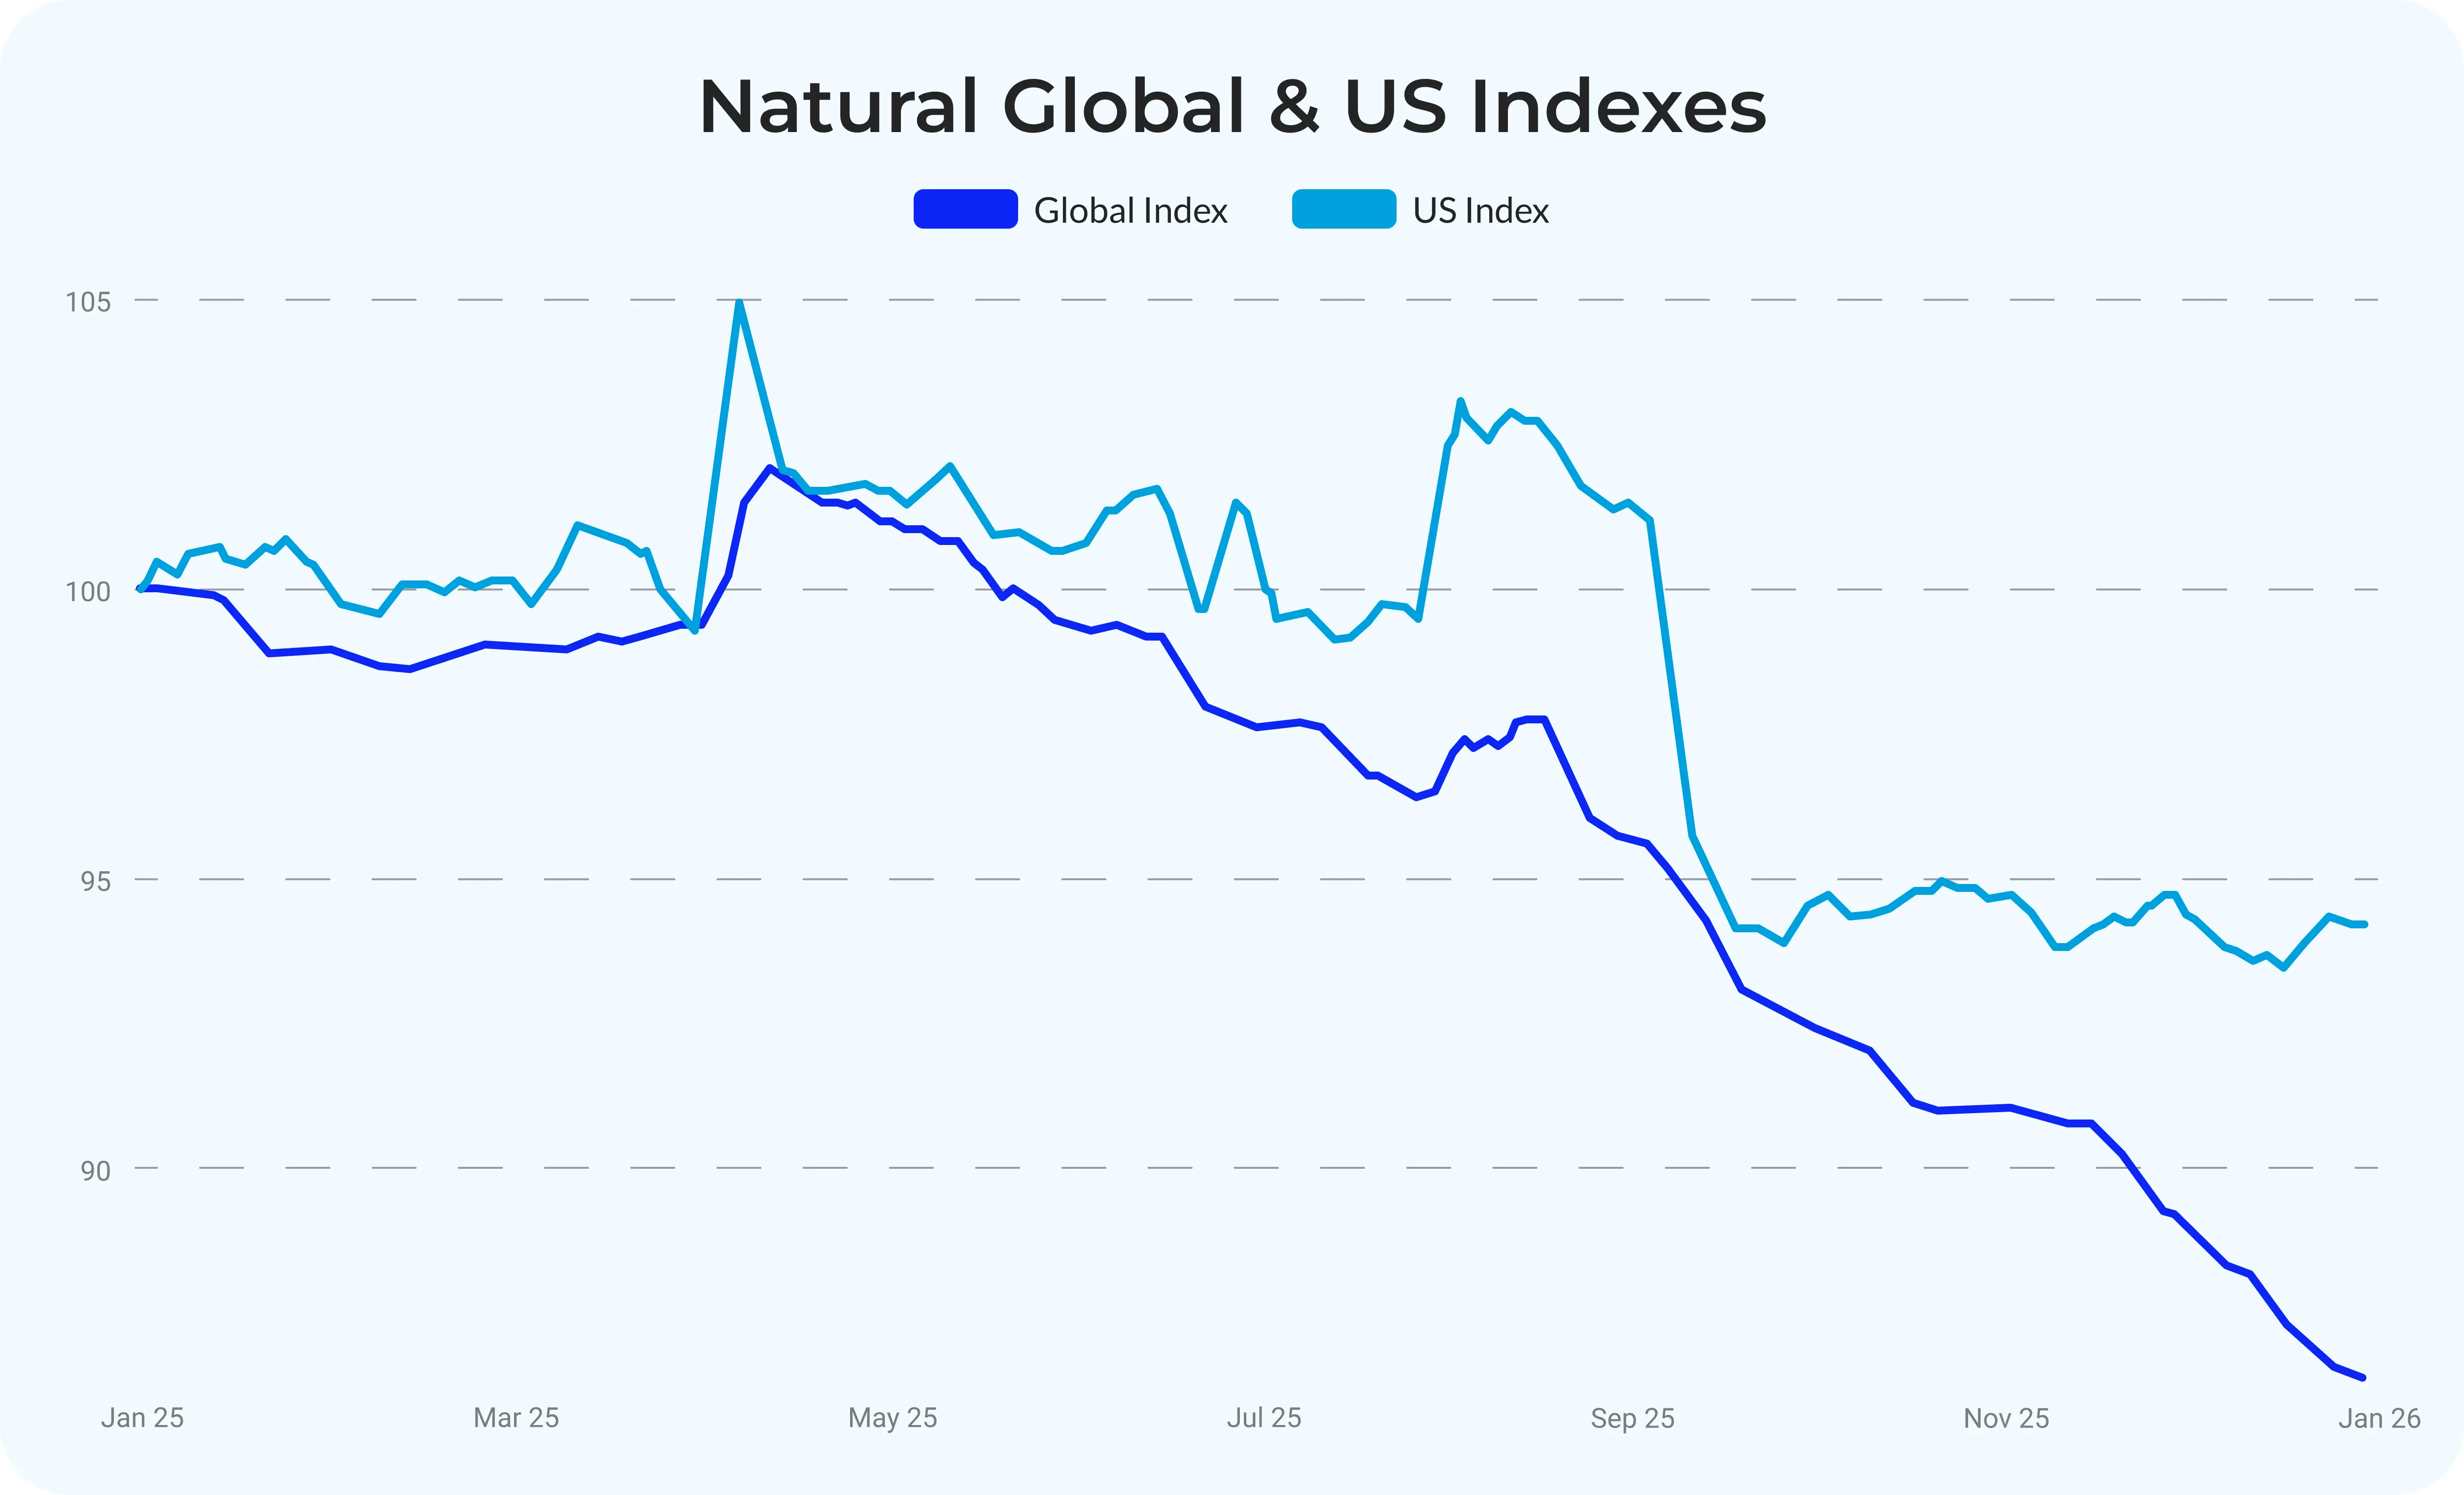
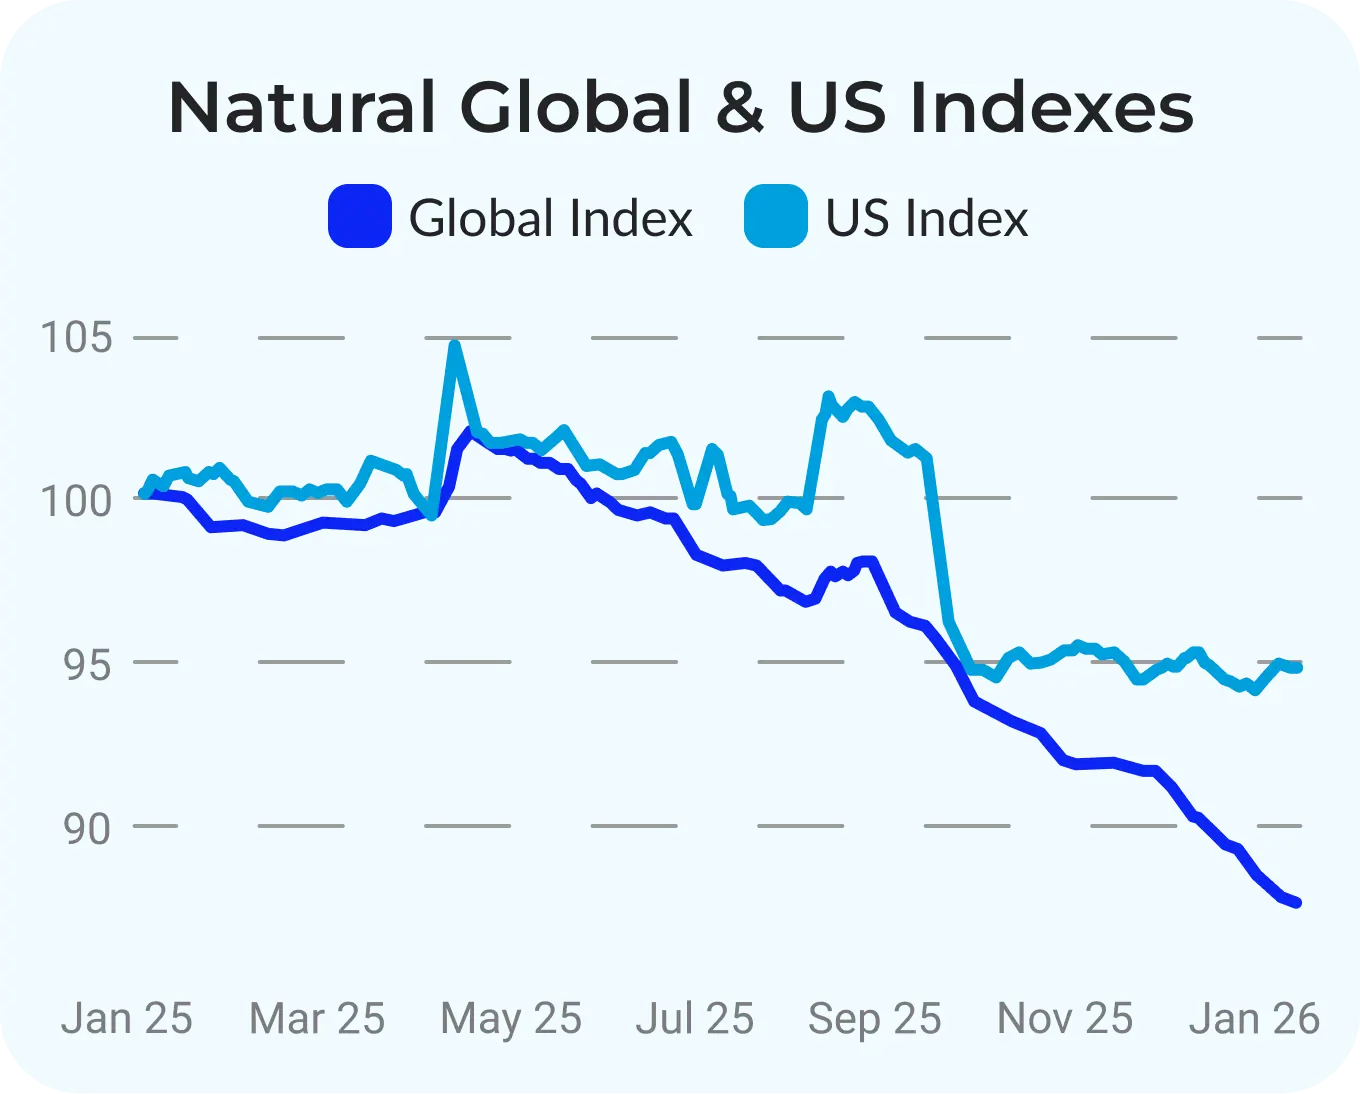
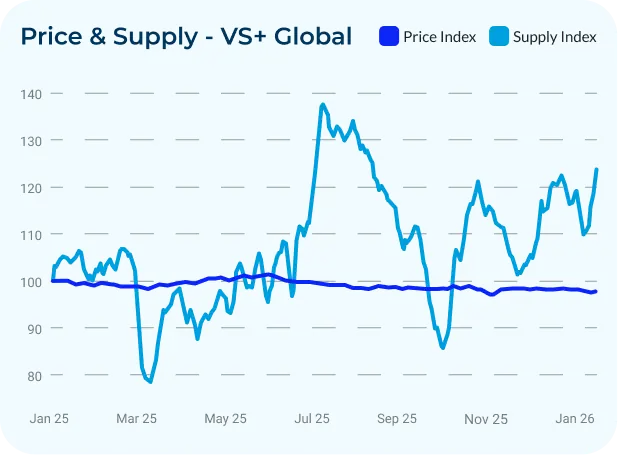
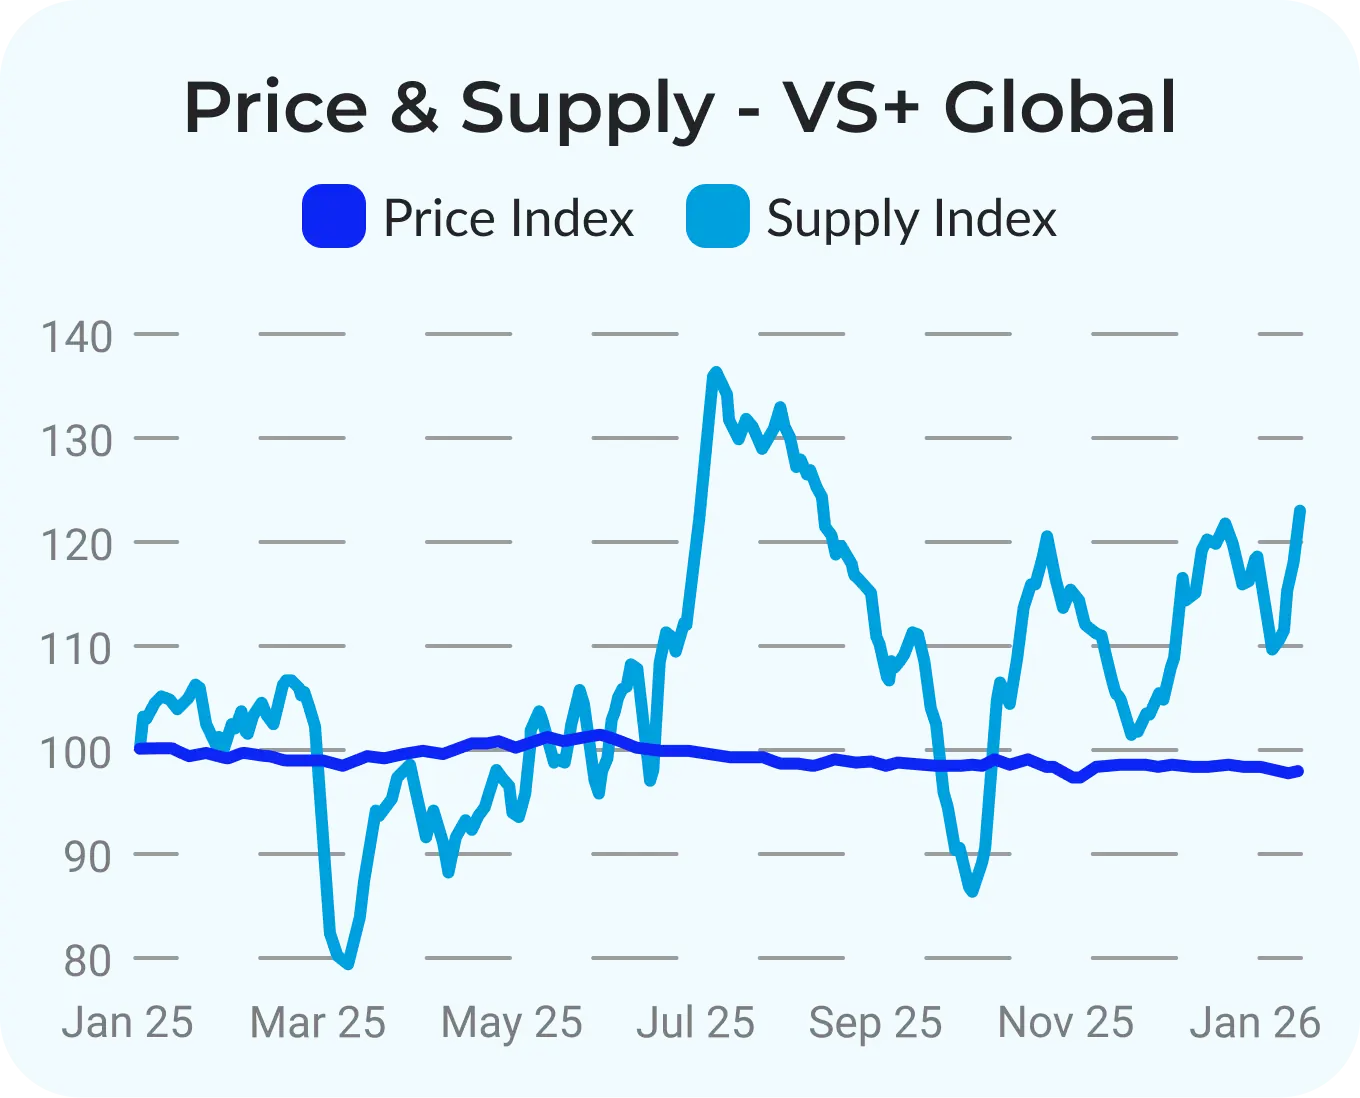
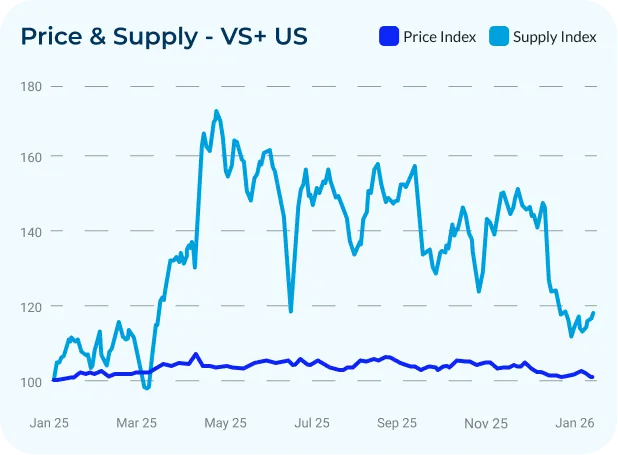
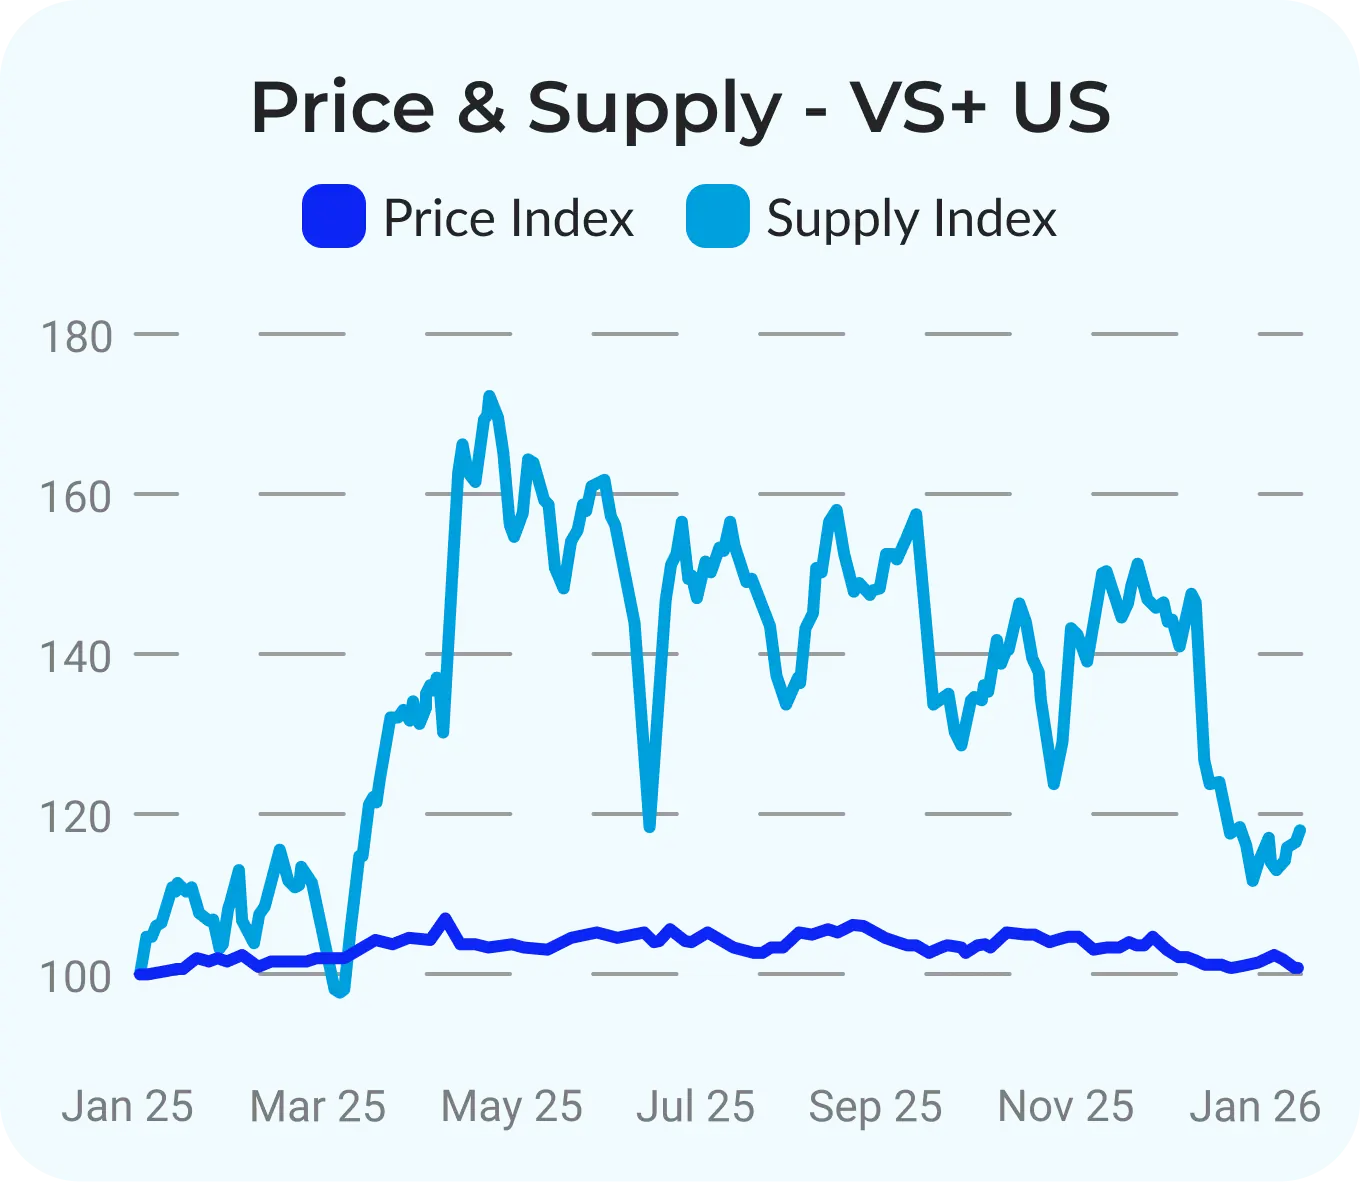
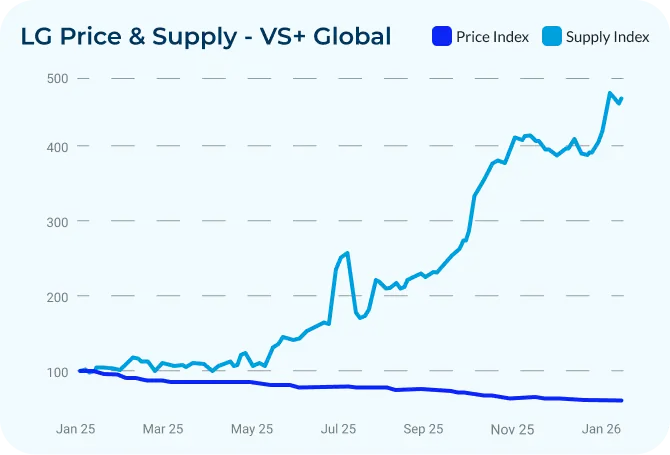
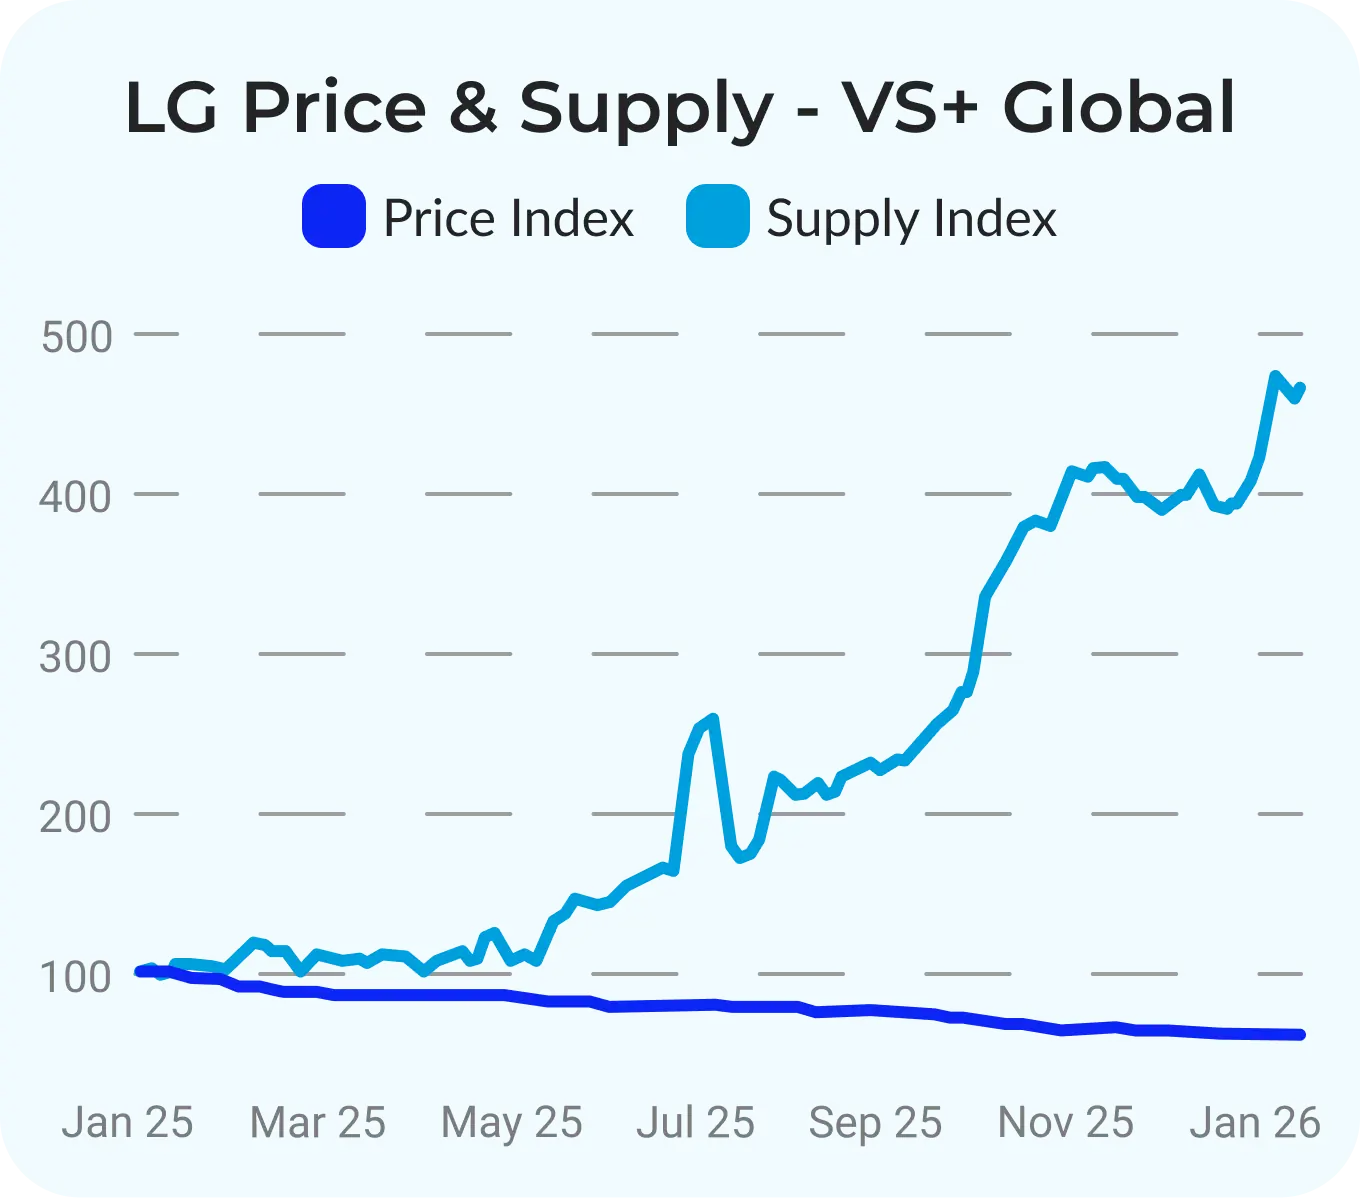
The most useful way to read 2025 is not as a single index line, but as a market that began pricing in “movement risk.” The Diamond Index finished the year down 14%, but prices of inventory located in the United States declined just 6%. That spread captures what changed. In 2025, the route to the buyer became part of the market outcome, not just the stone itself. The year moved in recognizable bursts around tariff turning points: the April 2nd announcement and the minimum 10% tariff applied from April 5th created a short, concentrated scramble to reposition and transact under clearer terms, while the August tariff increases on Indian goods, 25% from August 7th and up to 50% from August 27th, turned uncertainty into real cost and triggered a broader reset that carried into year end.
The industry also did not respond through one uniform mechanism. Some goods were repositioned into the US, while other workflows emerged to reduce exposure, including non-traditional routes such as mounting in Mexico to avoid tariff burden on loose stones. This matters because the market was not only adjusting prices, it was adjusting logistics, timing, and where inventory was held, and that behavior showed up directly in the stability gap between US-positioned goods and goods outside the US.
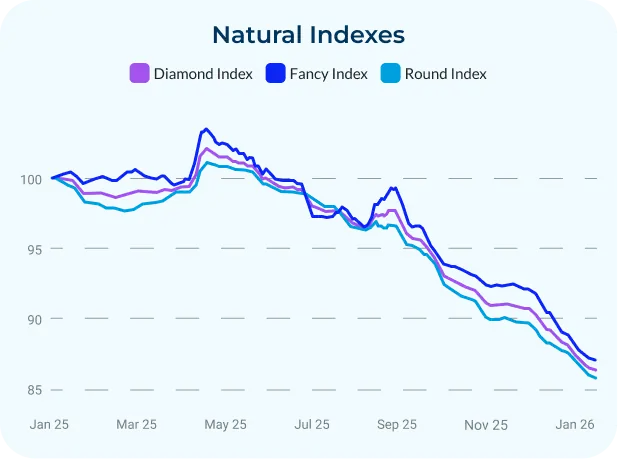
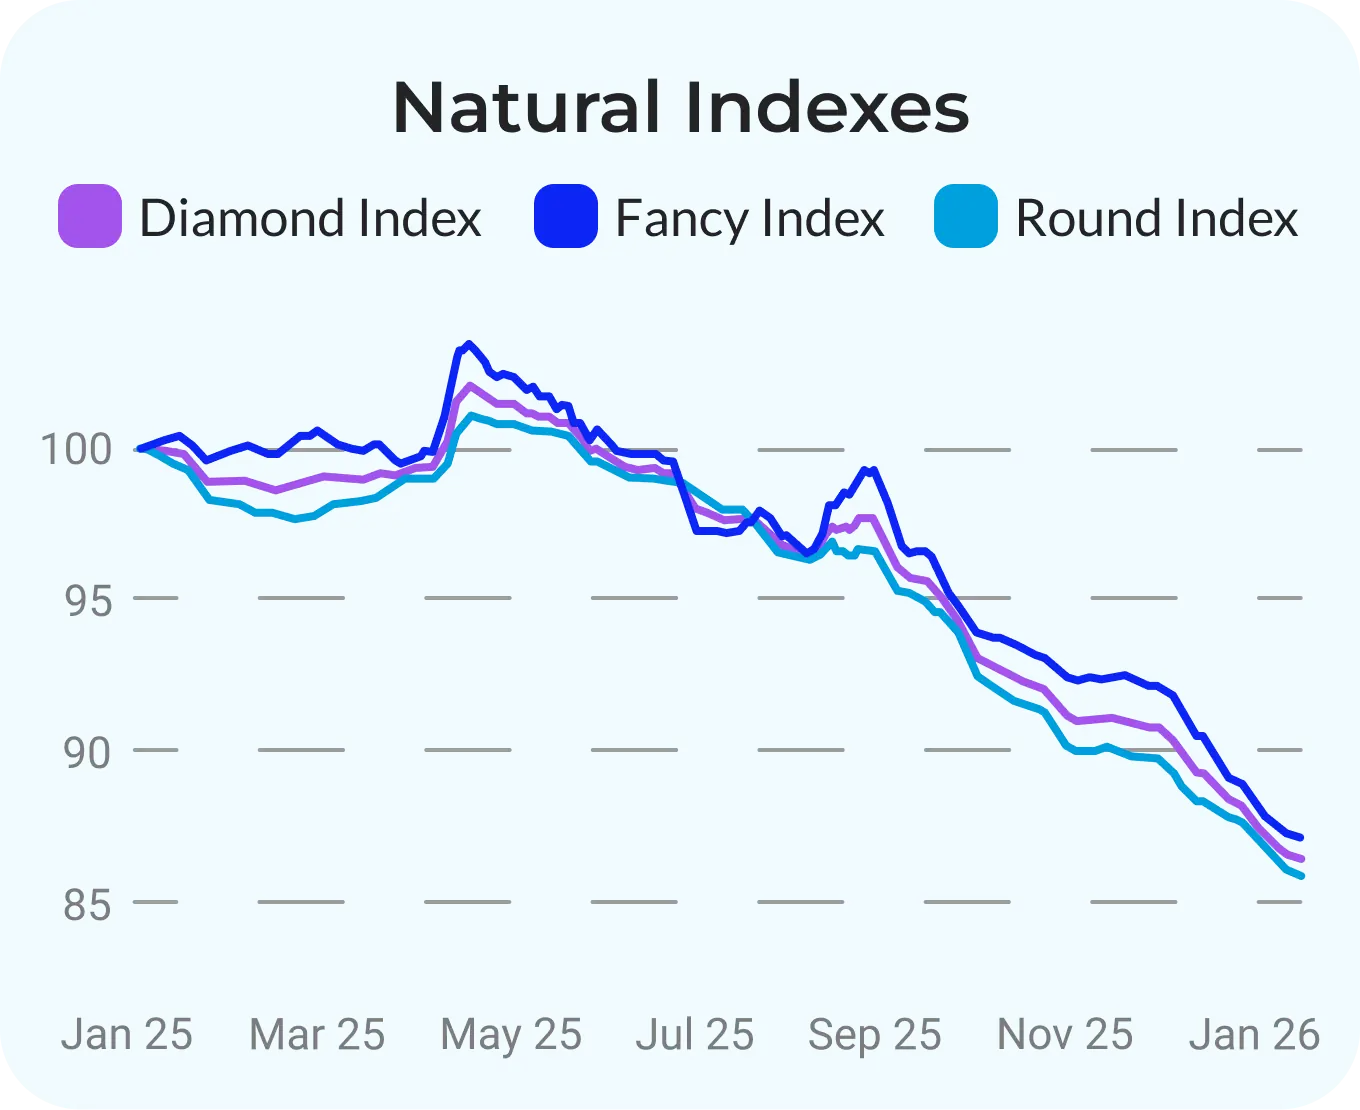
Rounds declined 14% in 2025, reflecting sustained pressure through the year, with added stress whenever tariff headlines and implementation changed the cost of sourcing. Fancies declined 13% and held up slightly better at the index level, but the real story in fancies was dispersion by shape and size thresholds rather than one broad move: the biggest declines were concentrated in goods below 1ct across shapes, pears 1ct and above stood out as stable with overall price increases, and ovals saw clearer weakness below 1ct.
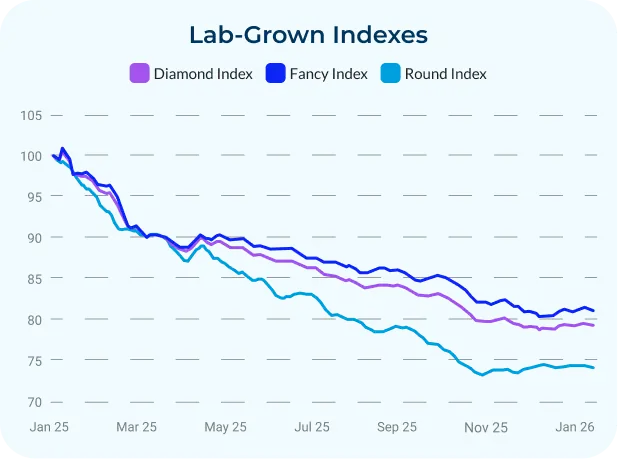
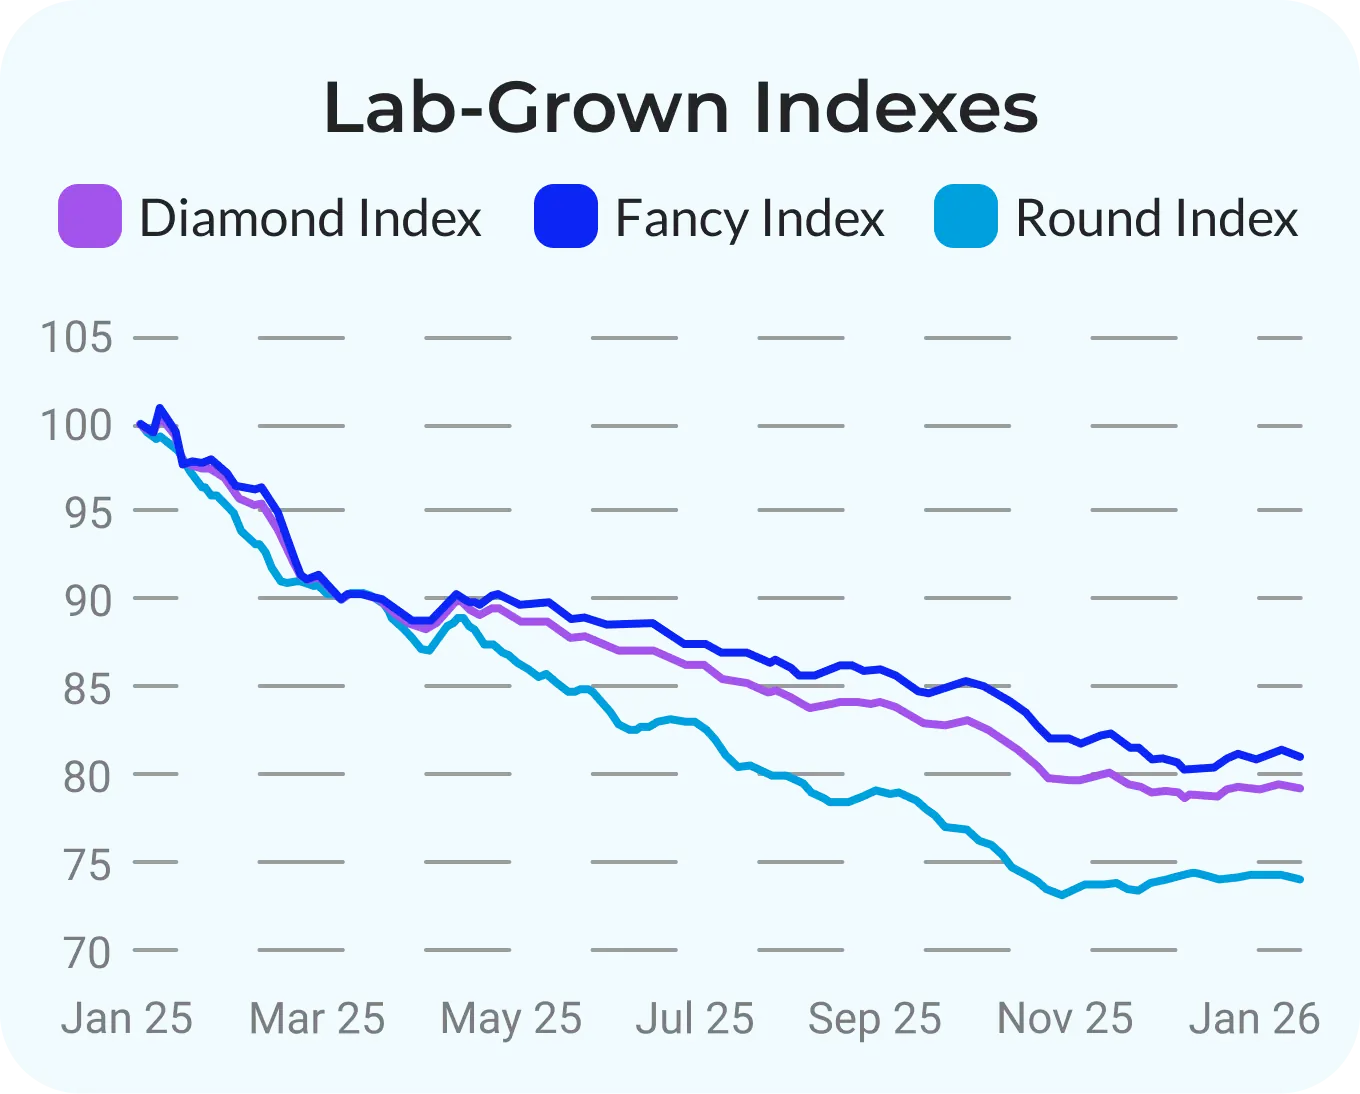
Lab-Grown declined 21%, with repeated step-down resets tied to constant availability and intense competition.
Rounds and Fancies by Size Group
Natural 0.30ct
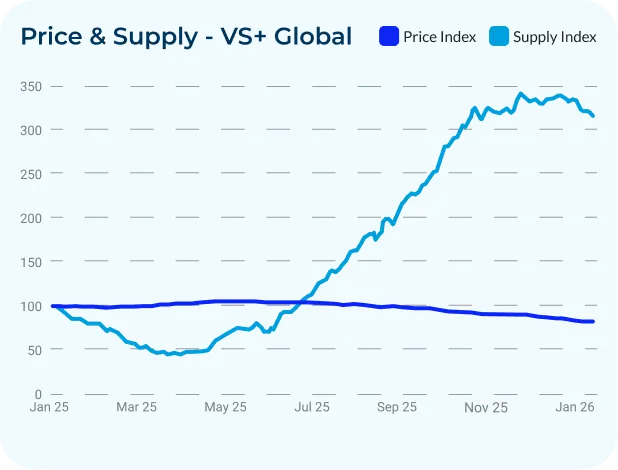
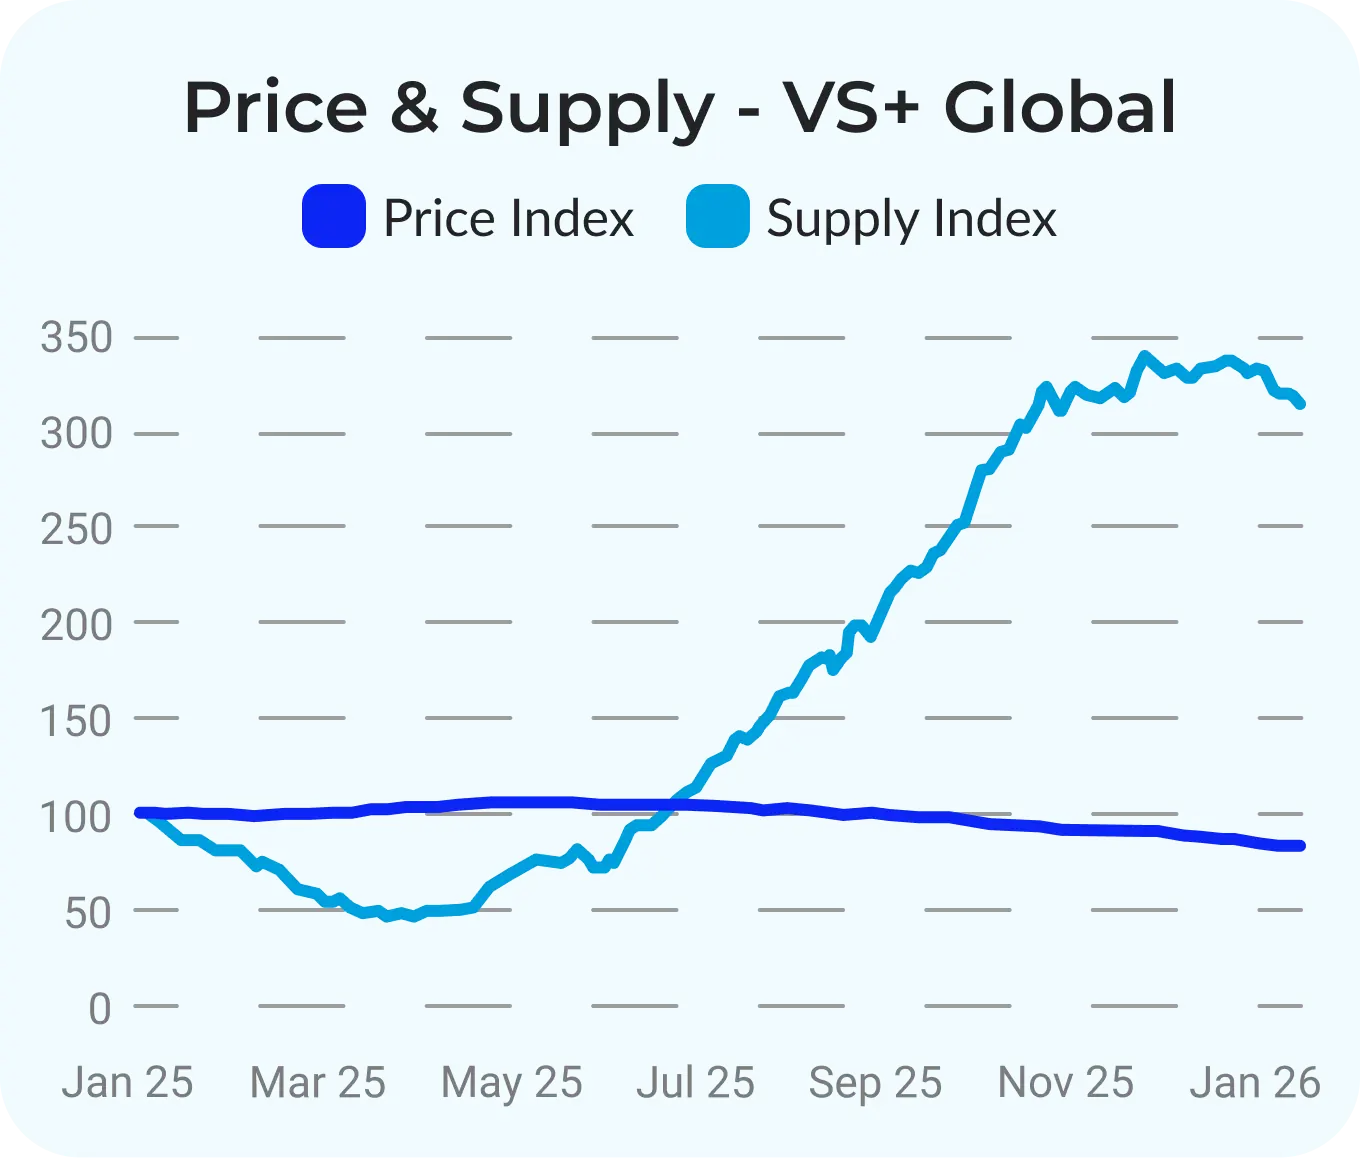
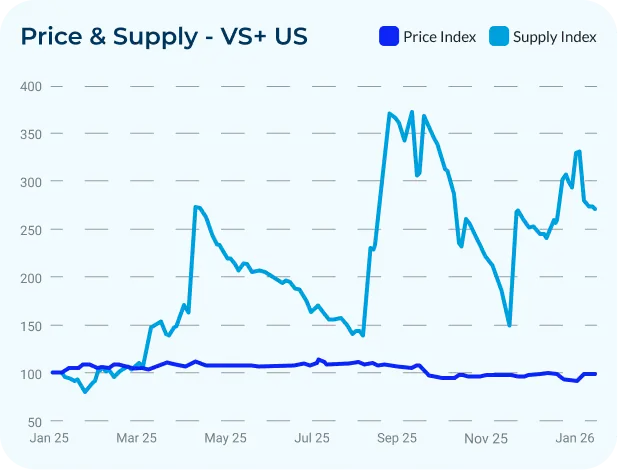
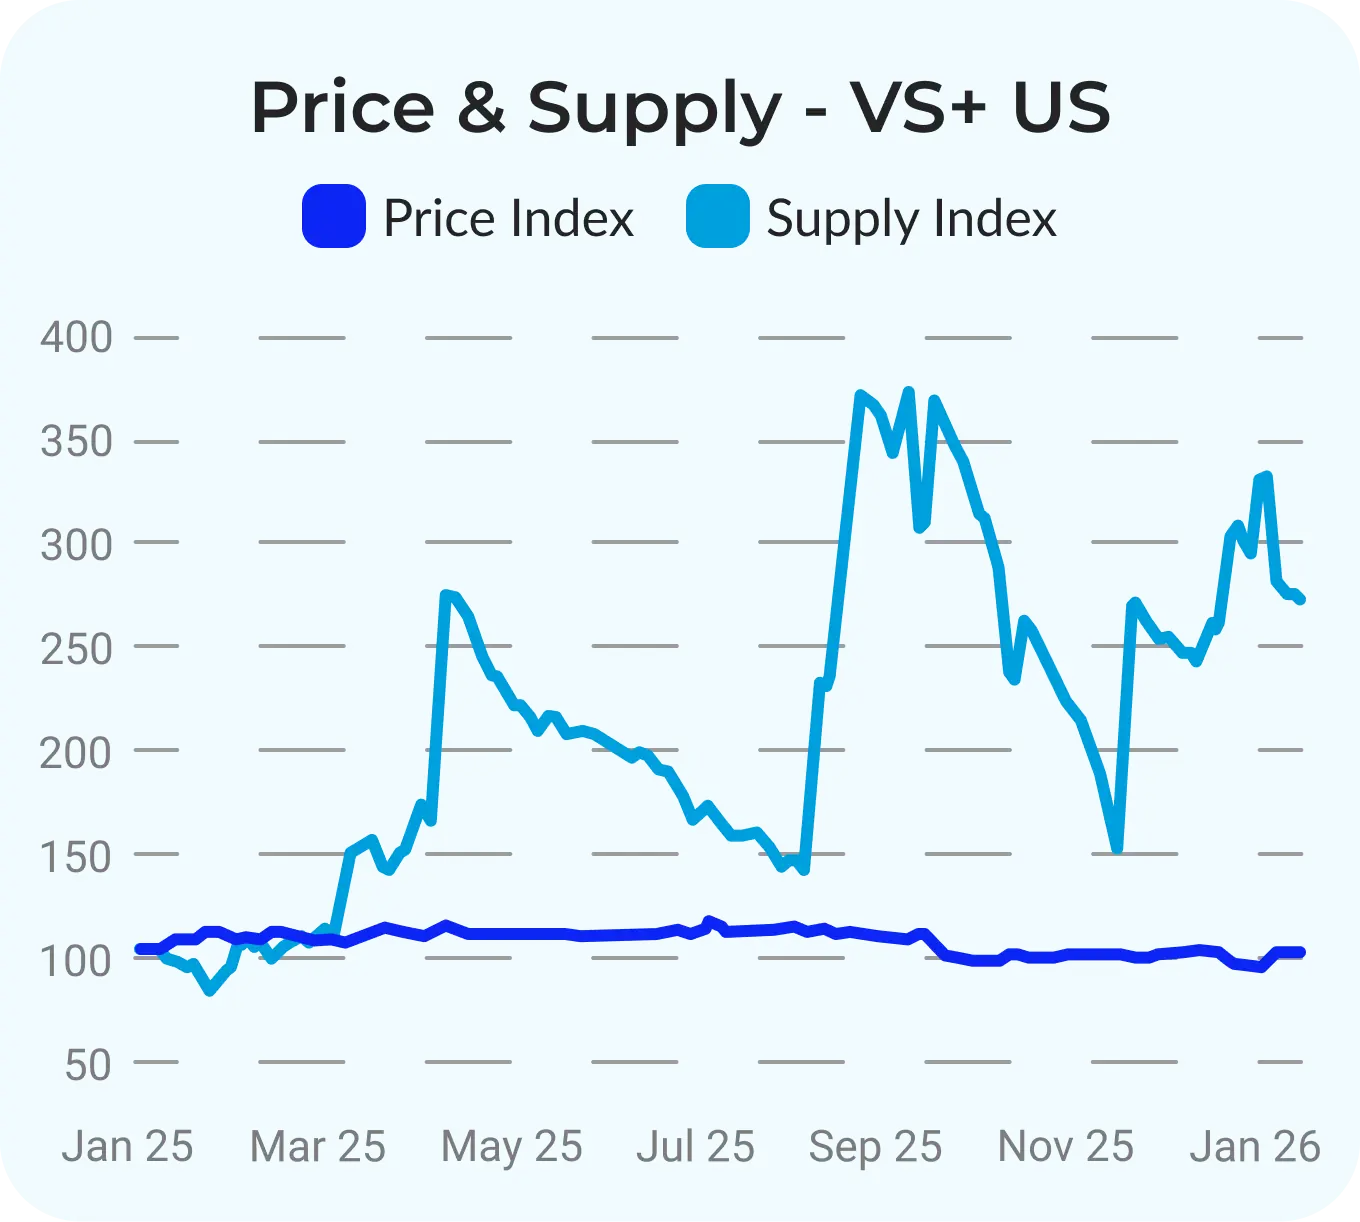
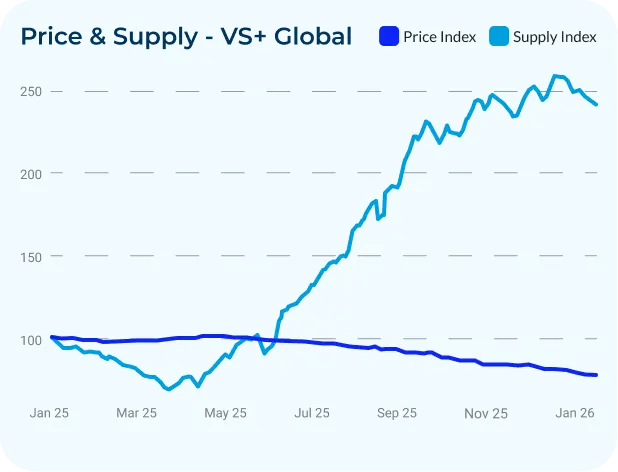
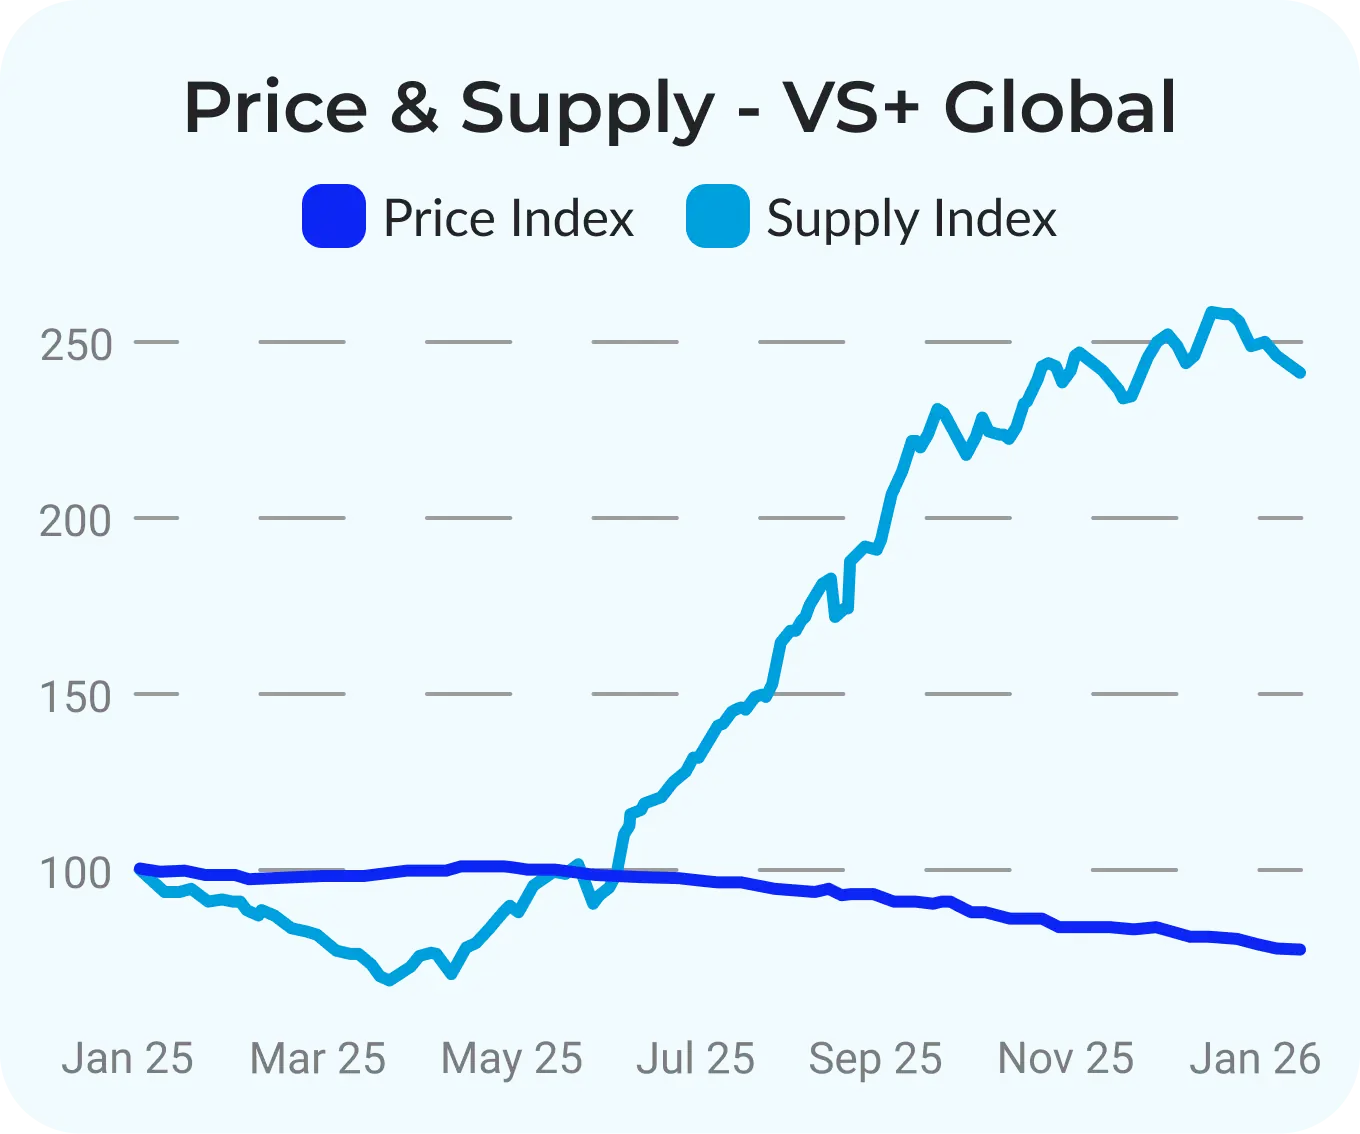
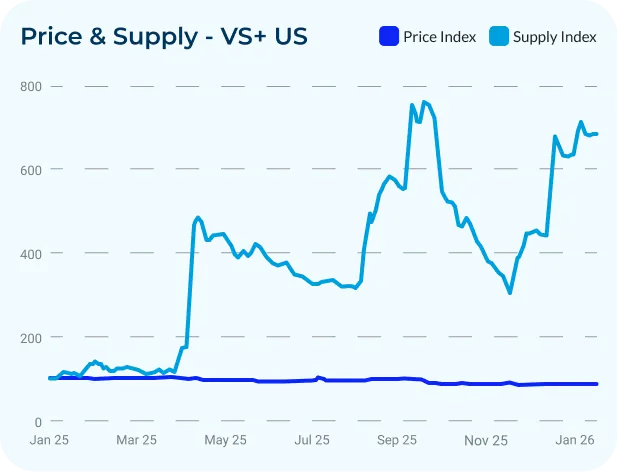
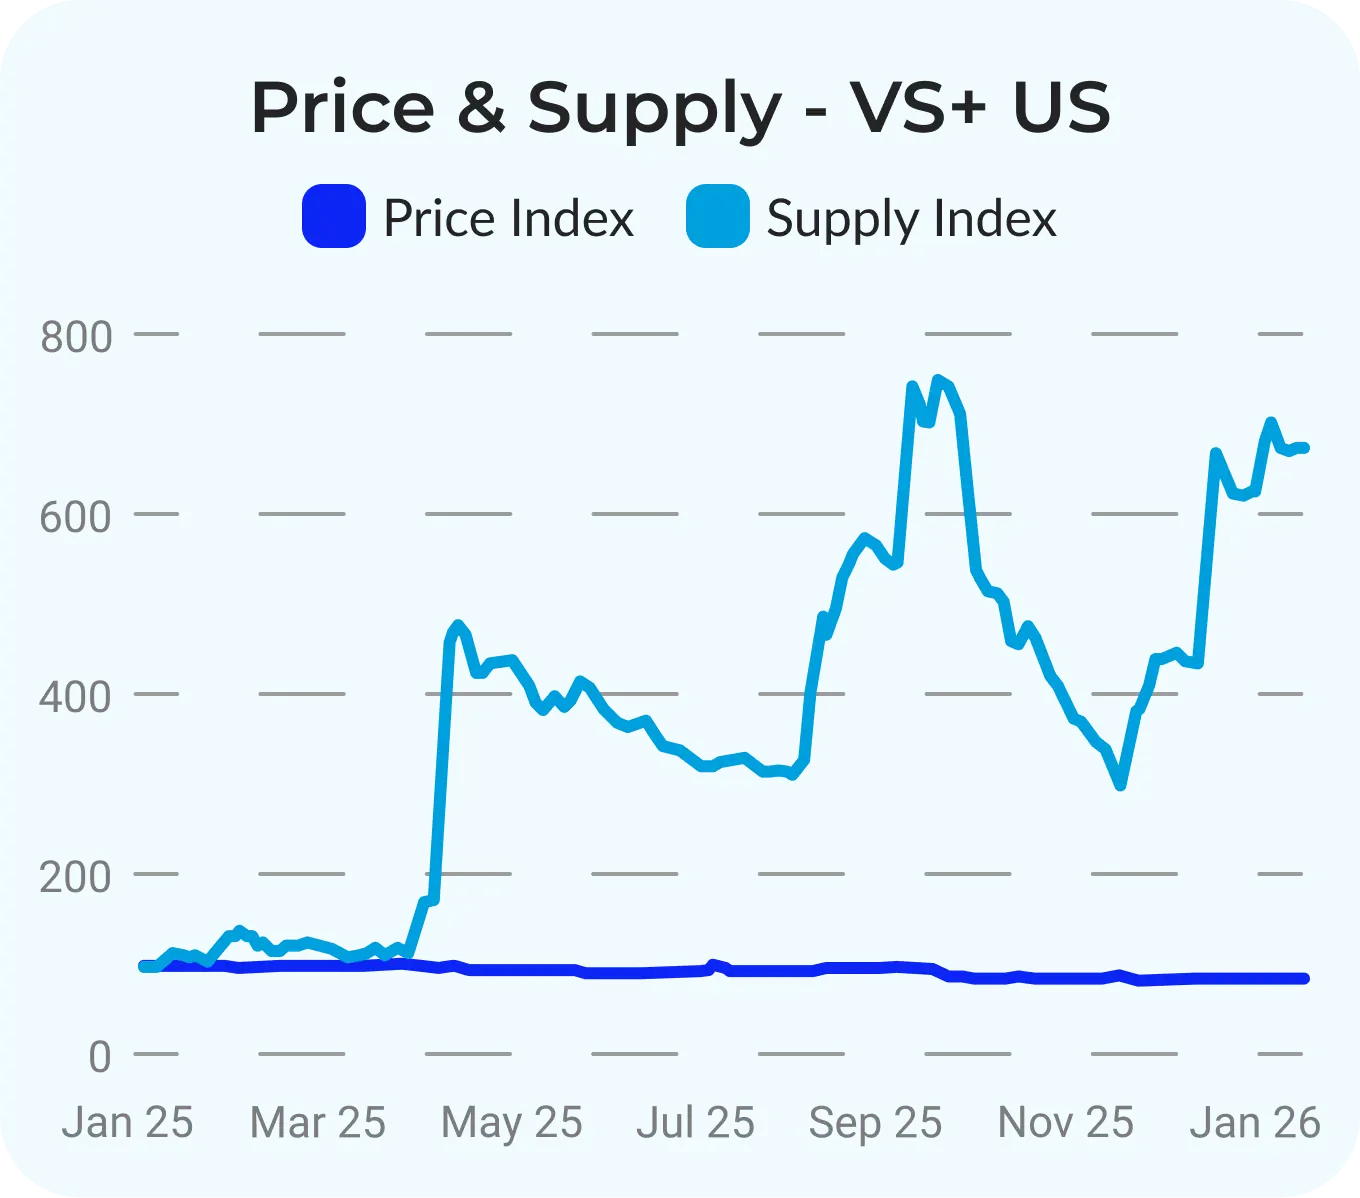
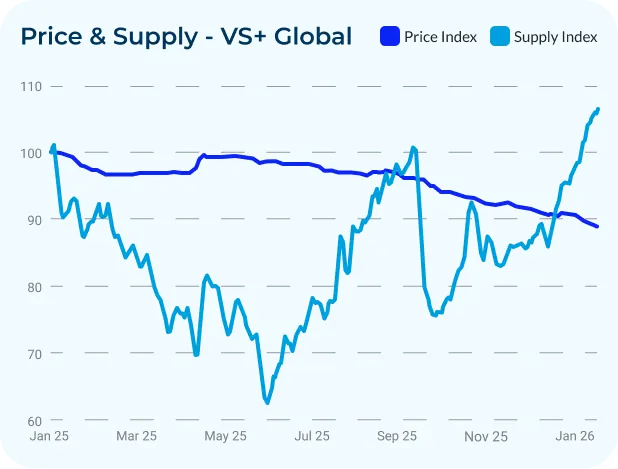
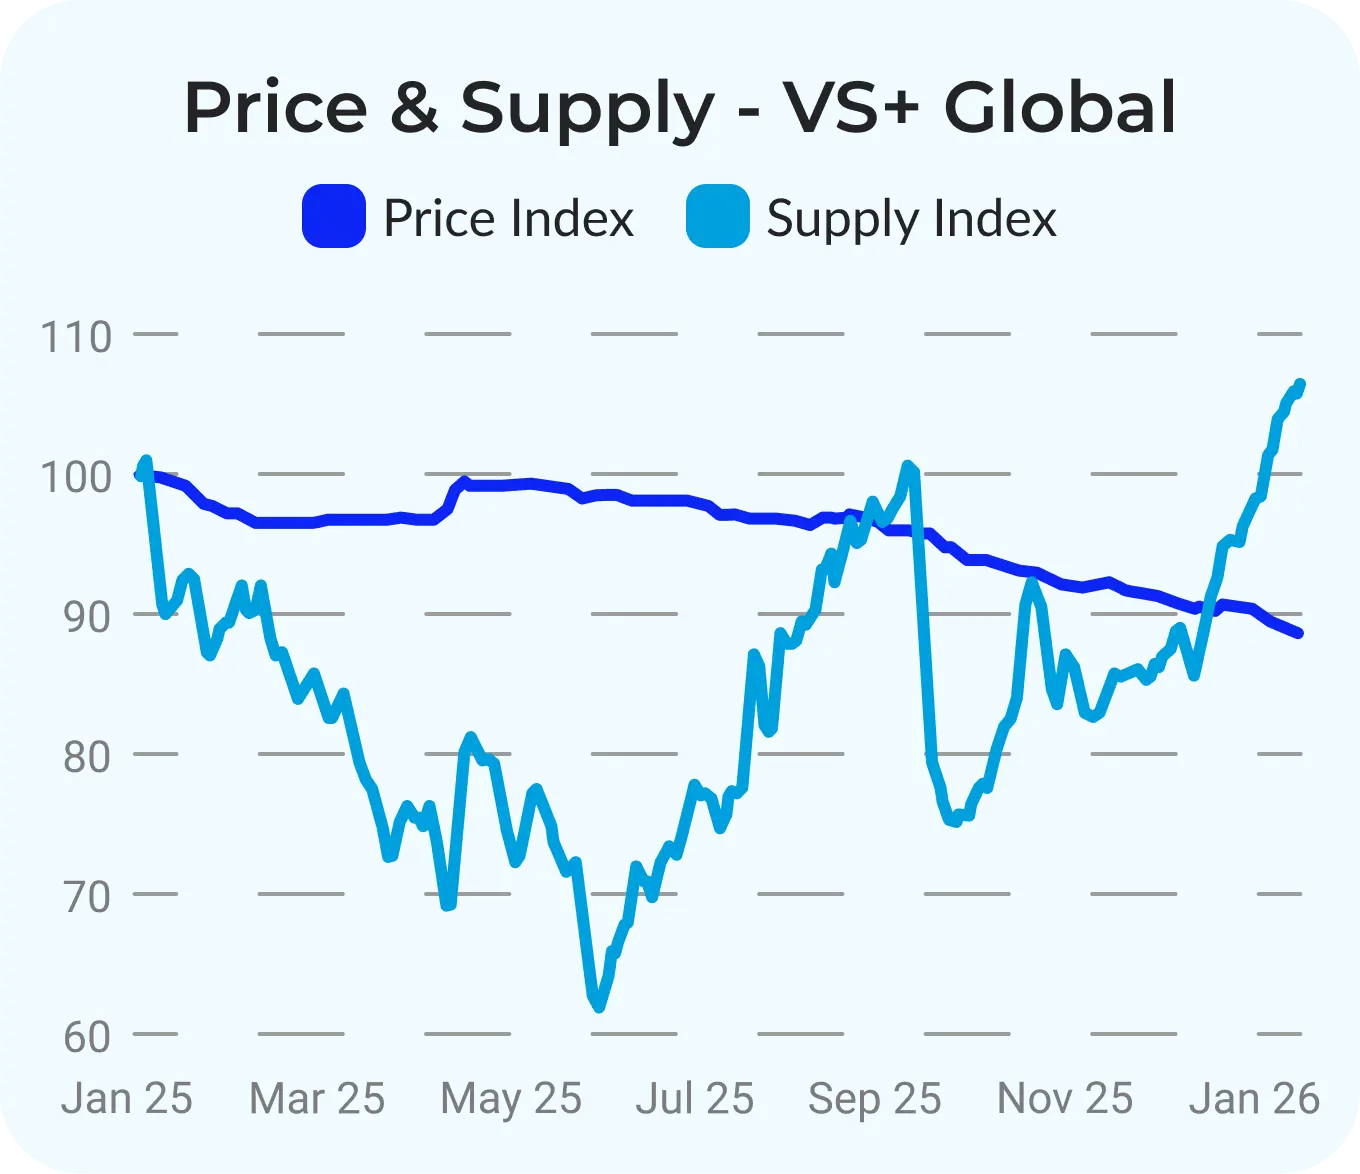
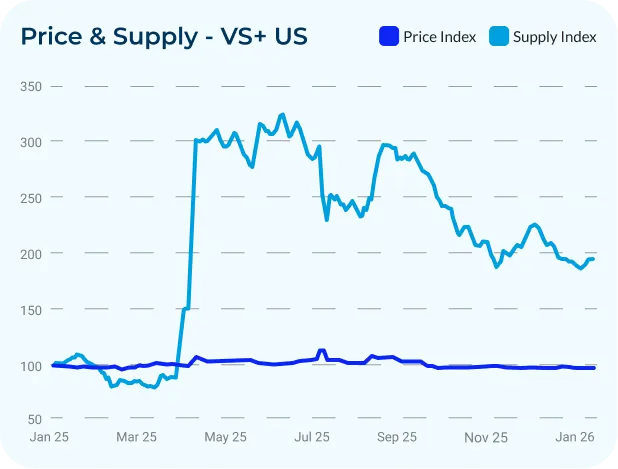
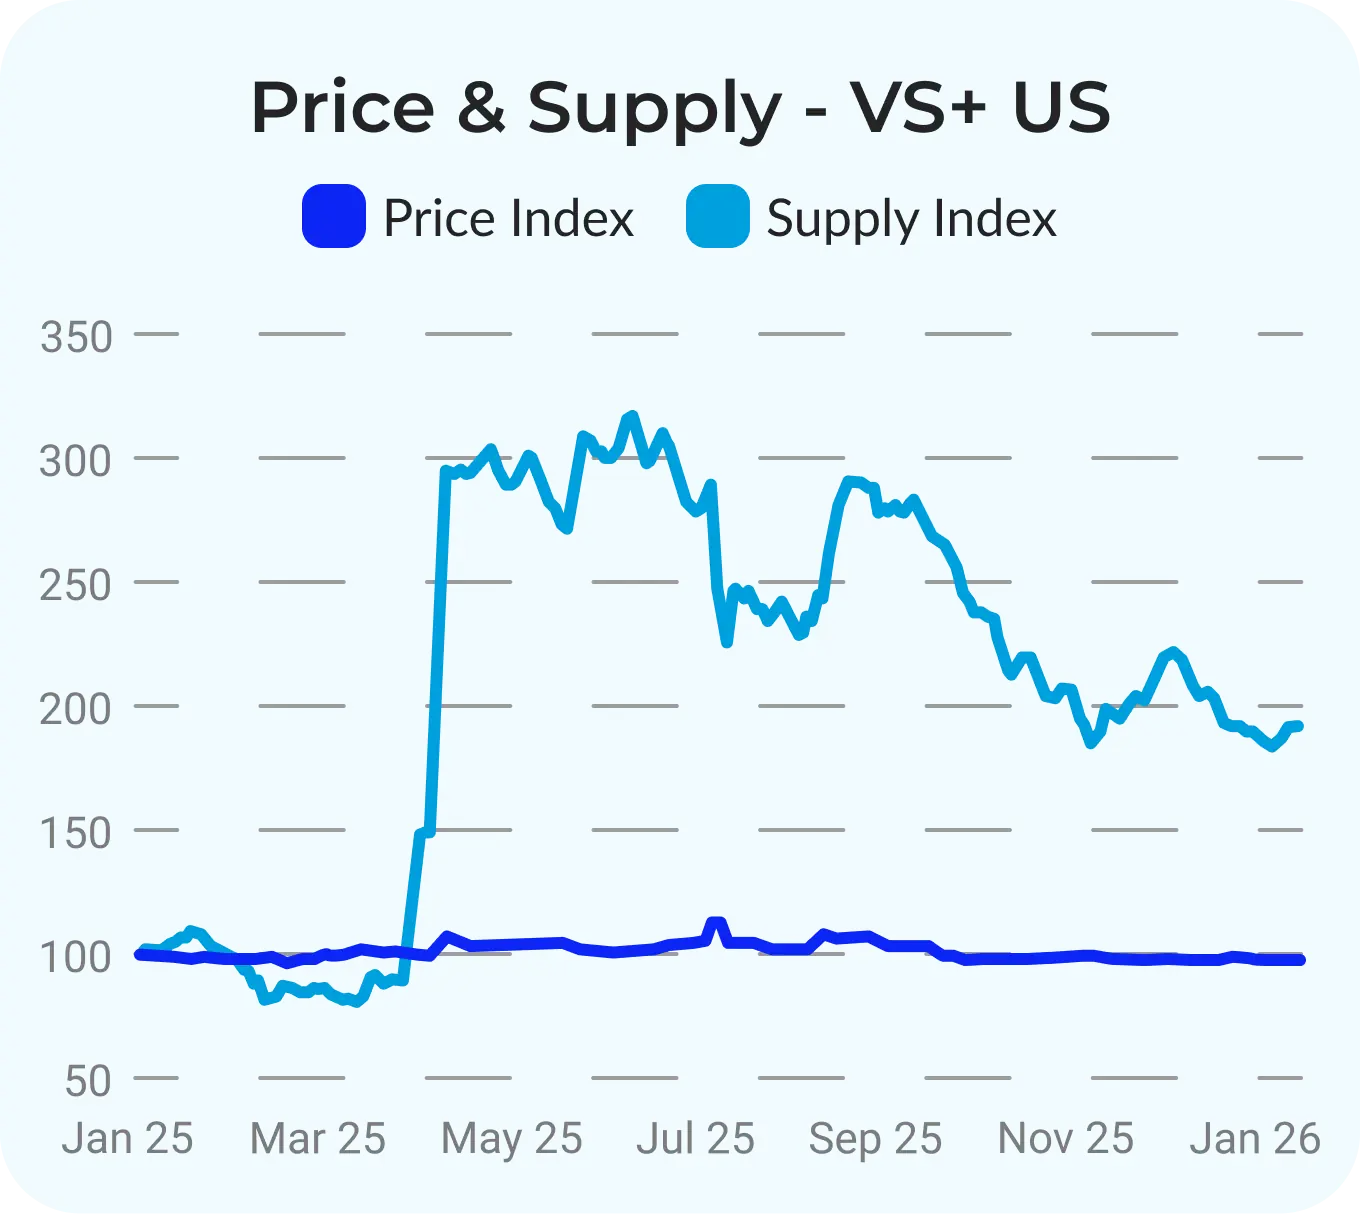
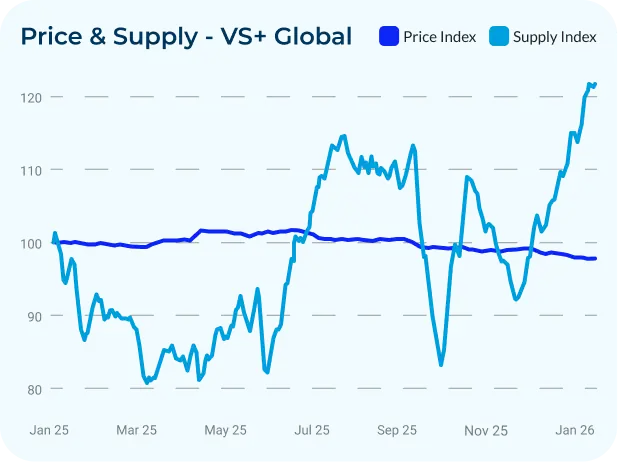
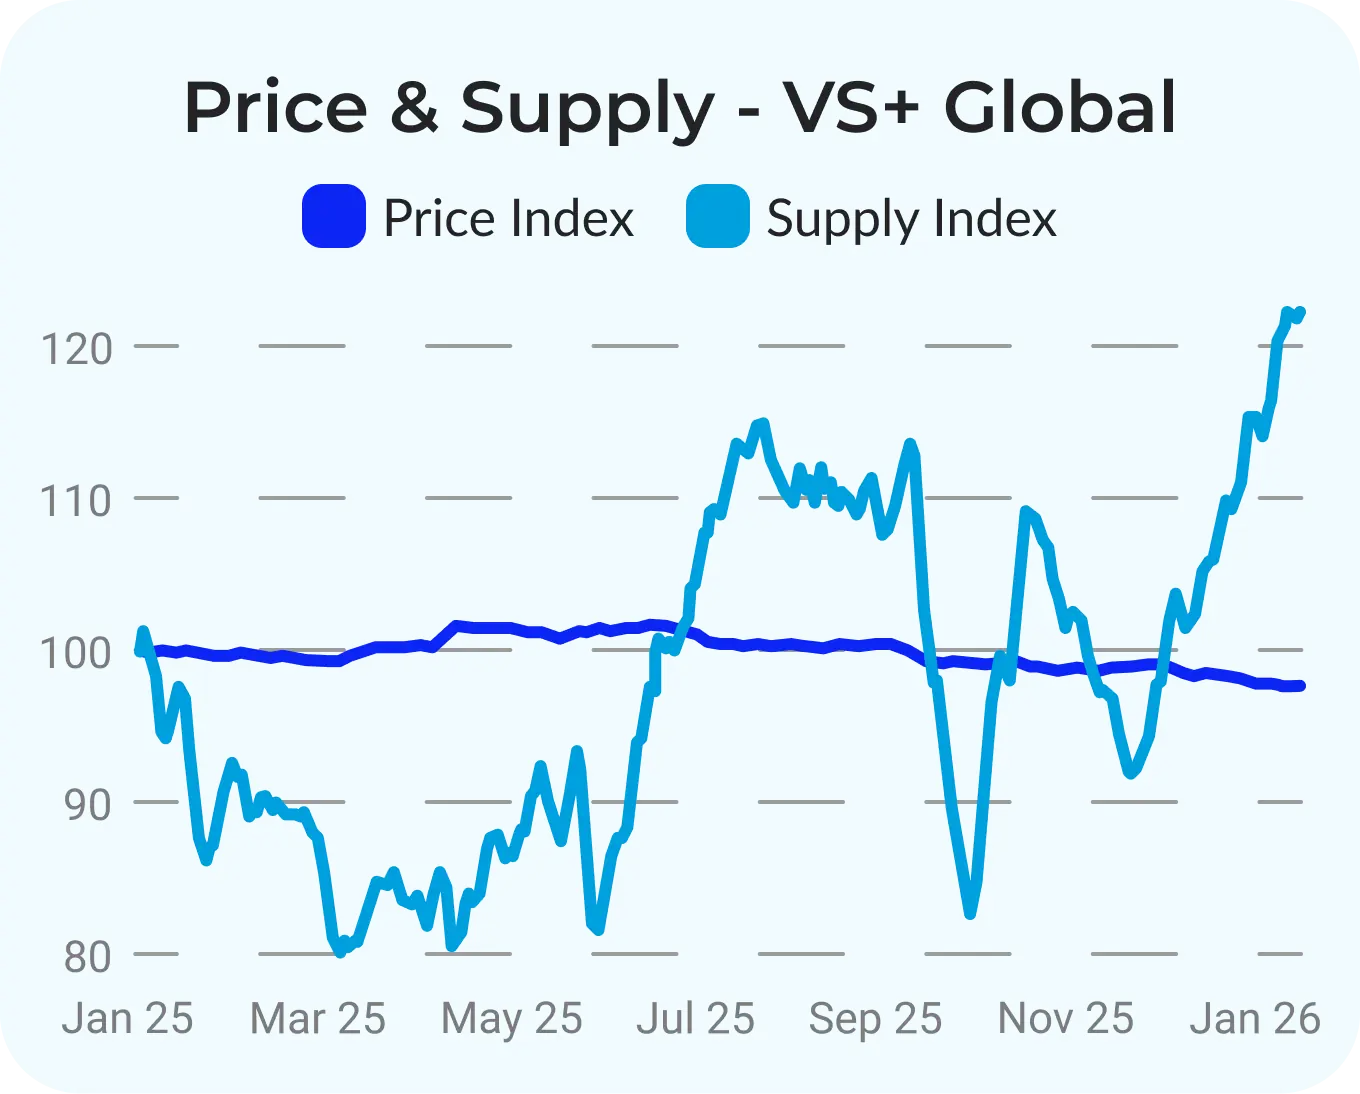
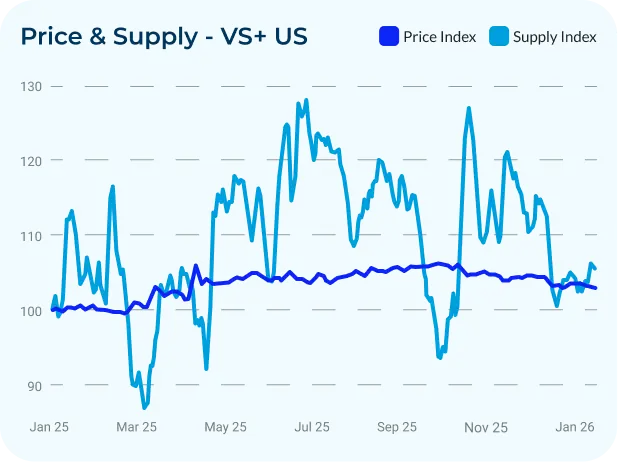
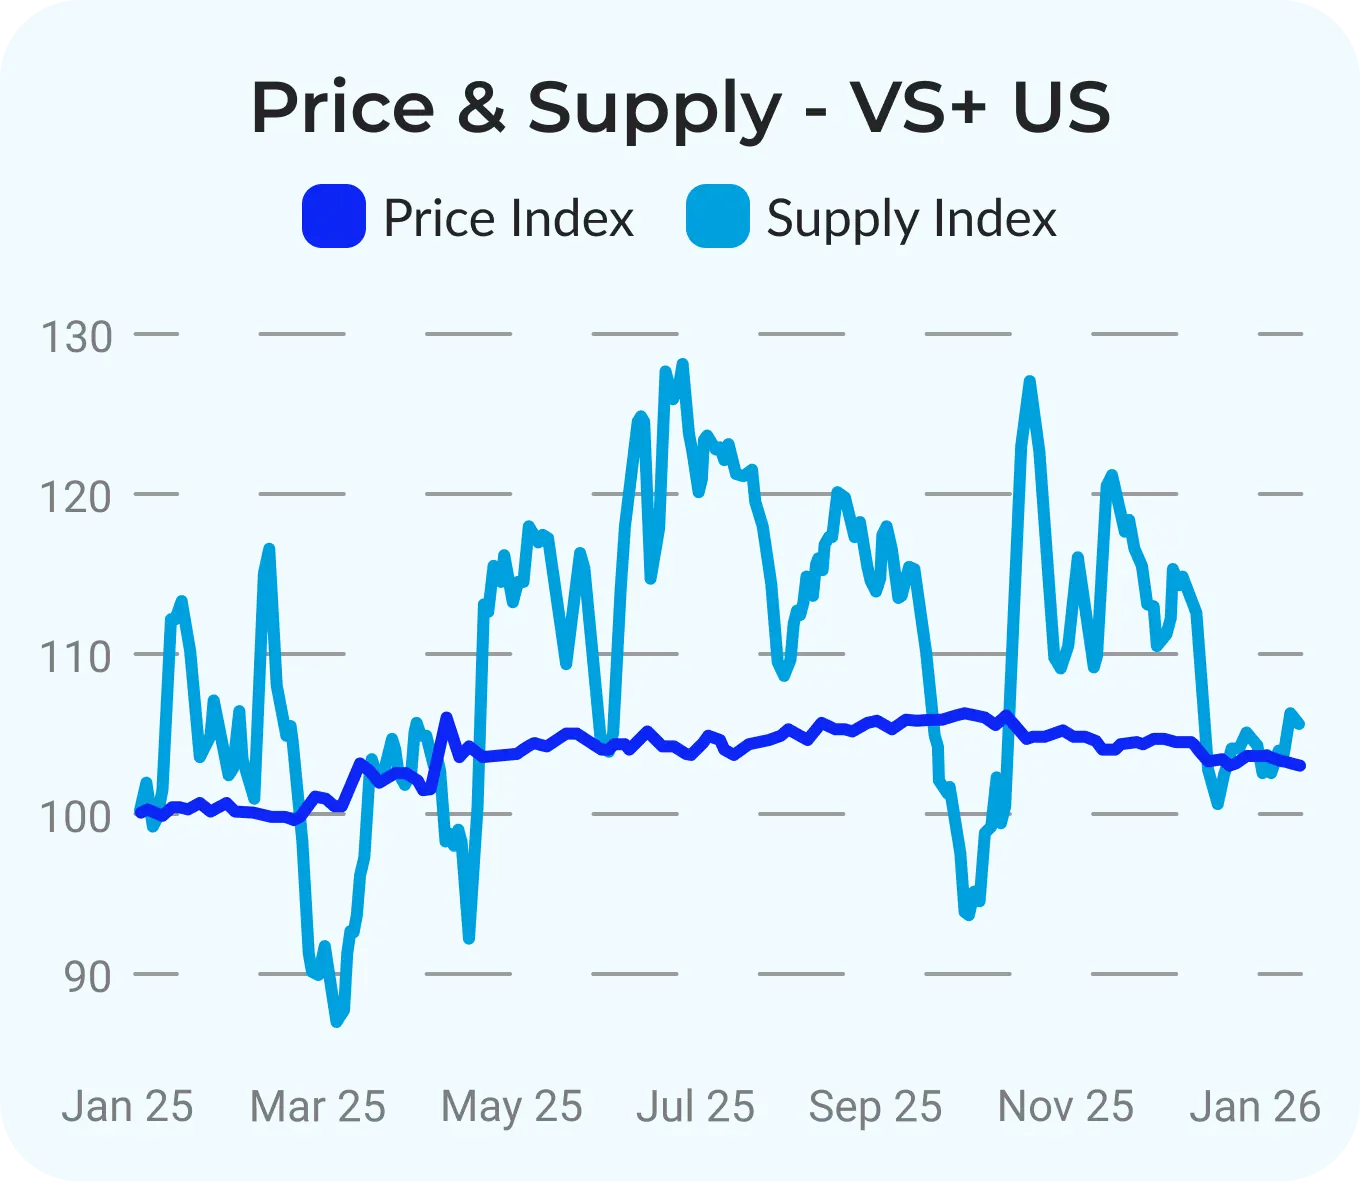
Natural Round 0.30 VS+ stone prices fell 17% while supply rose 204%. The year split into two halves. In the first half, supply dropped meaningfully and pricing held up better, even moving higher for a period. In the second half, supply rose quickly, availability returned, and prices adjusted downward, with the segment becoming strongly supply-driven.
The US picture was notably different. For VS+ stones located in the US, prices were essentially stable, down just 1%, even though supply rose 170%. US pricing did not weaken gradually across the year. Prices rose slightly in the first part of the year, stayed stable, and the main adjustment occurred in September. The April supply spike in US inventory aligns with the repositioning of goods into the US ahead of higher tariff risk later in the year, and a second spike appears in August aligned with tariff implementation. After the September adjustment, prices remained stable through year end, showing that US inventory absorbed rising supply with far less damage to price.
In 0.30ct Fancies, pricing pressure was broad, with significant decreases across shapes. The exception was Pear-shaped SI stones, which were the only category in this size group that showed price increases during the year. The contrast between 0.30ct Pears globally versus in the US is also one of the clearest examples of 2025’s location effect. 0.30ct Natural Pears declined by 30%, but prices dropped only 3% in the US.
Natural 0.50ct
Round 0.50 VS+ stones saw a meaningful price correction. Prices decreased 23% over 2025 while supply rose 140%. The timing mattered. Prices were relatively stable for the first five months, then the decline became consistent as the market moved deeper into the second half with rising availability and weaker pricing power.
Supply explains the shift. Supply decreased through April, then reversed direction after the first tariff announcement and rose steadily through the remainder of the year. Once availability turned, pricing did not just soften, it kept sliding into year end.
The US pattern followed the same tariff-linked structure seen in 0.30cts, but with larger supply swings. For VS+ stones located in the US, prices declined 14% over the year. Supply was steady early on, then jumped after the tariff announcement as goods moved into the US. By year end, US supply was up sharply. Two supply spikes stand out, one around April with the announcement of tariffs and another in August aligned with implementation. Despite the surge in US availability, pricing remained more controlled than the broader market, but the added supply still translated into a meaningful decline by year end.
In 0.50ct Fancies, the story was simpler and more uniform. All fancy shapes saw significant price decreases in 2025, showing that pricing pressure in this size group was not limited to Rounds.
Natural 1ct
Round 1ct VS+ stones were more stable than the smaller sizes, but still saw a decline. Prices decreased 11% over 2025. A small lift appeared in April following the tariff announcement, then prices moved into a steady decline throughout the rest of the year.
Supply increased only slightly overall, rising 6% by year end, but the path was uneven. Supply fell in the first half and recovered in the second half.
US-located 1ct inventory again held firmer. For VS+ stones located in the US, prices declined just 3% across 2025. Supply reacted sharply after the April announcement, jumping by around 200% as inventory was repositioned into the US, and finishing the year up 95%. Even with that added availability, pricing stayed relatively steady versus the broader market.
In 1ct fancies, the dispersion by shape becomes clearer than the index suggests. VS+ Pears saw a price increase in 2025, while the rest of the 1ct Fancy shapes saw price decreases. This aligns with the broader Fancy pattern, where the largest declines cluster below 1ct and performance becomes more shape-led as size increases.
Natural 2ct
Natural 2ct VS+ Rounds were stable in 2025, with prices decreasing by just 2% over the year. Even in this steadier size group, tariffs still show up in the timing, with a small lift around April following the tariff announcement, but after that pricing stayed far steadier than the smaller categories. Supply was more active than price, fluctuating through the year and ending higher by 22%, yet prices held in a tighter range even as availability changed. Inside 2ct, VS+ Collection goods remained particularly stable, with less than a 1% price decrease, compared to other clarities, that saw slight decreases.
The US view remained more resilient. For VS+ Natural 2ct stones located in the US, prices increased 3% over 2025, with an initial jump of around 5% after the April announcement and then stability through the rest of the year. Supply in the US fluctuated but stayed comparatively balanced, rising 5.5% by year end.
In 2ct Fancies, the “size threshold” effect is clearer than the index suggests. Pears saw an overall price increase in 2025, while other fancy shapes were mixed depending on shape, cut, and clarity. Emeralds are the clearest example of the threshold behavior: stable at 2ct and above, while below 2ct they saw price decreases, showing that the 2ct line acted as a dividing point in how the market absorbed pressure.
Lab-Grown 2ct
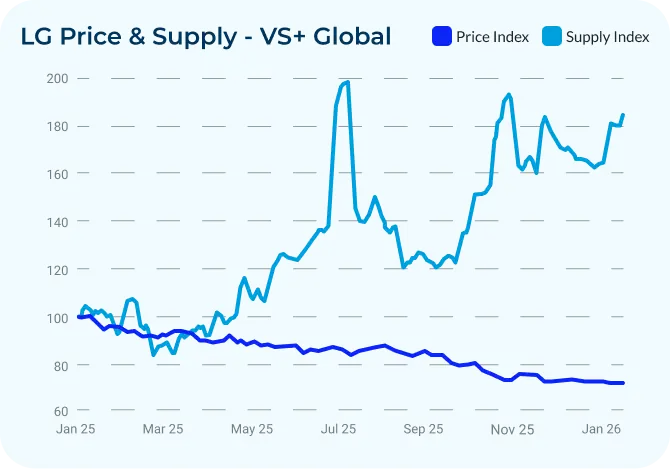
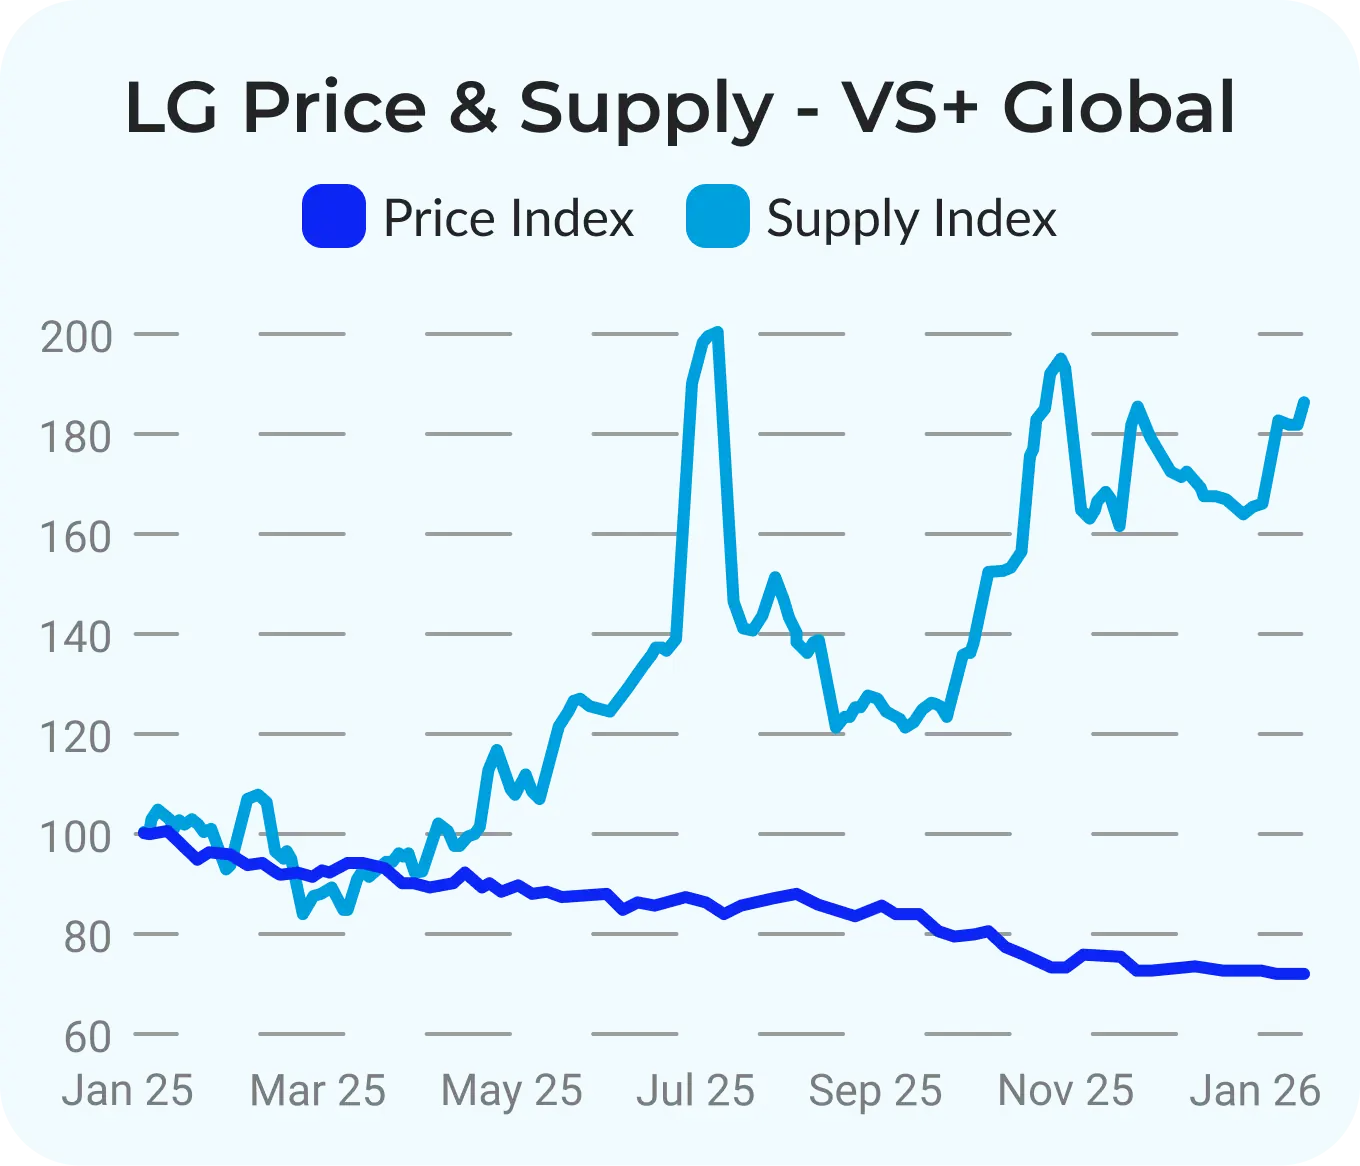
Lab-Grown 2ct Rounds sat on a different track entirely. Prices declined 28% over 2025 with a steady downward path, while supply rose 86%, keeping persistent pressure on pricing. With production capacity effectively unlimited and availability constant, the market kept stepping down in resets as competition stayed intense, creating a sharp contrast versus Natural 2ct, where pricing was comparatively anchored and more location-sensitive.
Natural 3ct
Natural 3ct VS+ Rounds were steady in 2025, with prices decreasing by just 2% over the year. Unlike below 2cts, there was no clear sustained trend up or down. Pricing stayed stable with only minor movement, showing this size was far less exposed to the year-long pressure that hit goods below 2cts and reinforcing the split market dynamic of 2025, where the correction concentrated lower down the size curve.
In the US, Natural 3ct VS+ Rounds were similarly stable, with prices increasing 1% over 2025. Tariff timing still appears in the background, with a small lift around April following the announcement, then minor movement throughout the rest of the year. Supply shows the repositioning more clearly, with a noticeable increase in April followed by fluctuations that did not translate into large price moves, reinforcing that US-located 3ct inventory traded with more stability in a tariff-driven year.
In 3ct Fancies, the same location signal shows up clearly. Natural 3ct Ovals in the US were more stable than the rest of the world, down 0.5% in the US compared to a decrease of just over 4% in the rest of the world. It is the same story expressed through a different shape: where inventory was located influenced how much it had to reprice when policy risk turned into real cost.
Lab-Grown 3ct
Lab-Grown 3ct moved in a different direction. Prices declined 40% over 2025, crushing throughout the year as availability remained constant and competition stayed intense. That contrast matters: Natural 3ct stayed relatively steady, while Lab-Grown 3ct kept repricing lower, showing how differently the two categories behaved under the same market backdrop.
Key Insights
Tariffs made location part of the price
Tariffs reshaped 2025 by adding uncertainty, not just cost. The biggest change was that where a stone was located started influencing how it traded, because cross-border buying came with more unknowns on timing and final cost once policy shifted. For US buyers, that meant sourcing from India suddenly became far less viable, which immediately reduced demand flowing to Indian suppliers and pushed more trading toward inventory already located in the United States.
Location became a stability signal
Stones located in the United States traded more steadily than stones outside the US. As tariff risk increased, inventory that was already stateside carried fewer surprises, so prices moved less. For buyers, this made location a practical filter, not just a logistics detail. For suppliers outside the US, it created a real disadvantage, because selling into the US became harder when buyers could no longer rely on predictable costs for goods coming from abroad. It also disrupted memo flows into the US, because tariffs had to be paid upfront, which made sending stones on memo far less viable.
Small rounds decreased harder than large rounds
Natural Rounds did not move the same way across sizes in 2025. The biggest price pressure stayed concentrated in smaller stones, with 0.30ct and 0.50ct stones showing the sharpest declines and remaining weak into year end, while 1ct also moved lower but in a steadier way. By contrast, 2ct and 3ct were far more stable, with much smaller price changes even when supply shifted, which made them lower-risk to hold for suppliers and more predictable to source for buyers compared to the sizes below 1ct.
Lab-Grown kept stepping down
Lab-Grown prices kept moving lower through 2025 because supply is effectively unlimited and availability stayed consistently high across sizes. For suppliers, this meant constant pricing pressure because there were always many comparable stones available in the market. For buyers, it meant flexibility: you could source when you needed without worrying about scarcity or not finding the stone, because there were plenty of options at any given time.
Conclusion
In 2025, tariff uncertainty did not just affect costs, it changed how the market traded. As tariffs became less predictable, location mattered more than ever before. Stones already located in the United States traded with more stability than goods outside the US, because buying across borders came with more unknowns on timing and additional cost. This also hit all the manufacturing centers, specifically Indian suppliers directly, as US buyers could not rely on predictable costs for stones coming from India, which reduced demand flowing to Indian goods.
Natural diamonds weakened, but it did not play out the same across every size and shape. The biggest pressure stayed in 0.30ct and 0.50ct rounds, where prices moved lower sharply and stayed weak into year end. Larger rounds were steadier, with 2ct and 3ct showing much smaller moves than the sizes below 1ct. Fancies added the clearest yearly insight through size thresholds. Pears were strongest at 1ct and above, while other shapes weakened most in the smaller sizes, including Ovals below 1ct and Emeralds below 2ct.
Lab-Grown followed a different pattern. Prices dropped sharply because supply is effectively unlimited and there were always many comparable stones available across sizes. For suppliers, that kept constant pricing pressure. For buyers, it created flexibility, because you could source when you needed without worrying about scarcity.
Ready to Elevate Your Diamond Trading?
Leave your details to book a demo and one of our representatives will get back to you as soon as possible!