Industry Report Q3 2025


Executive Summary
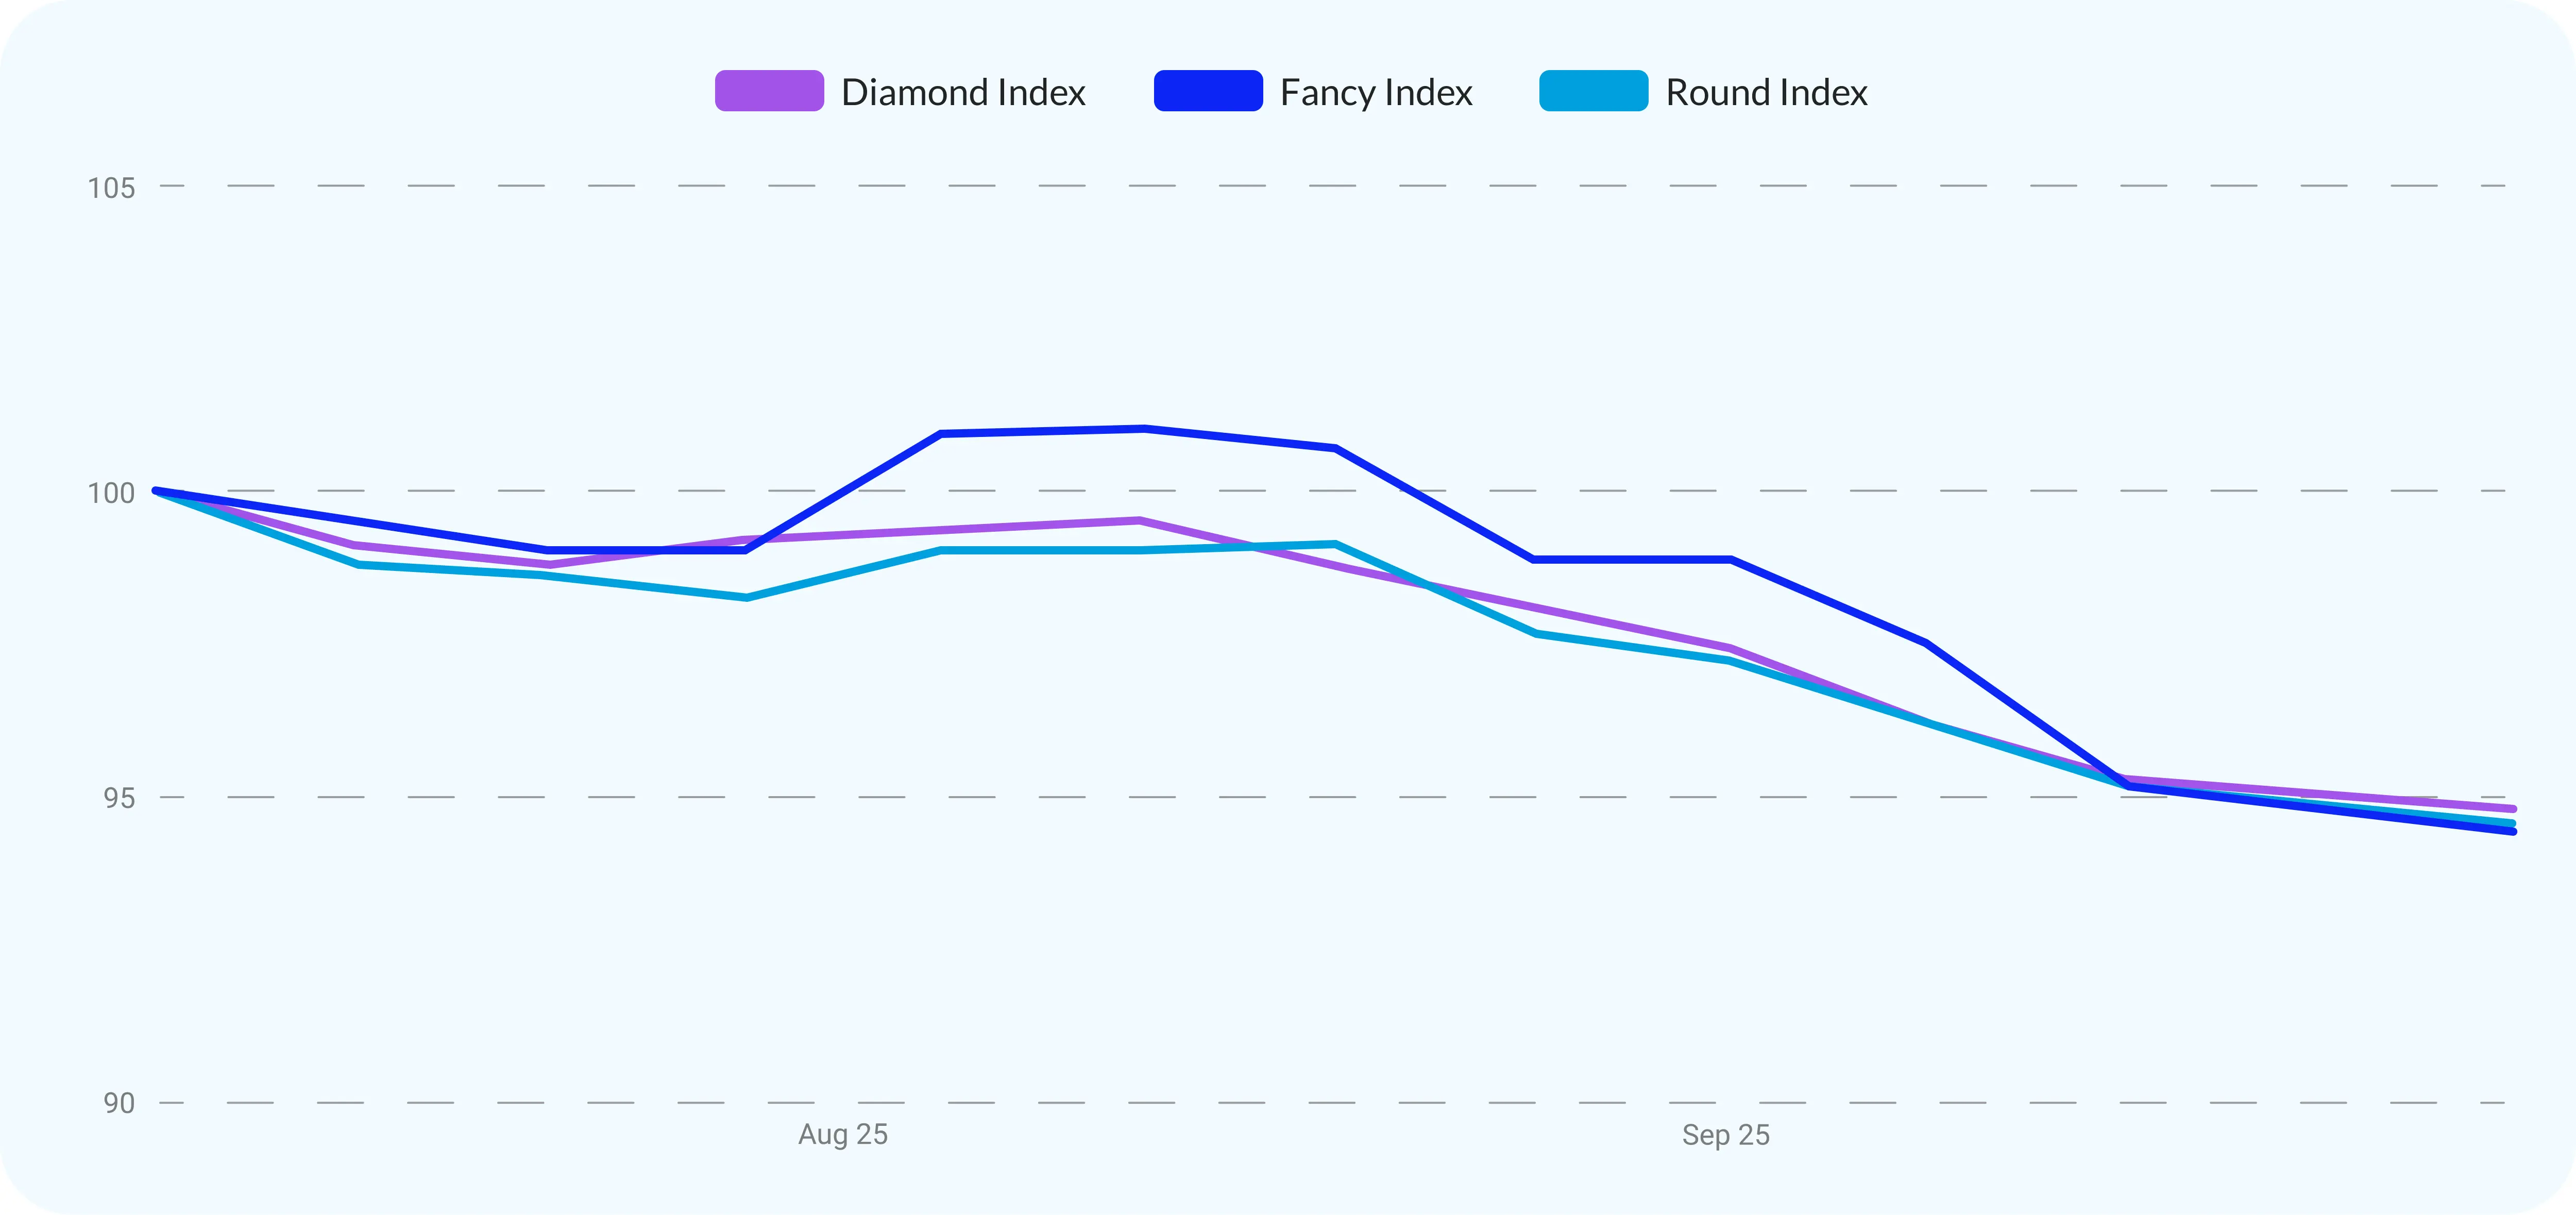
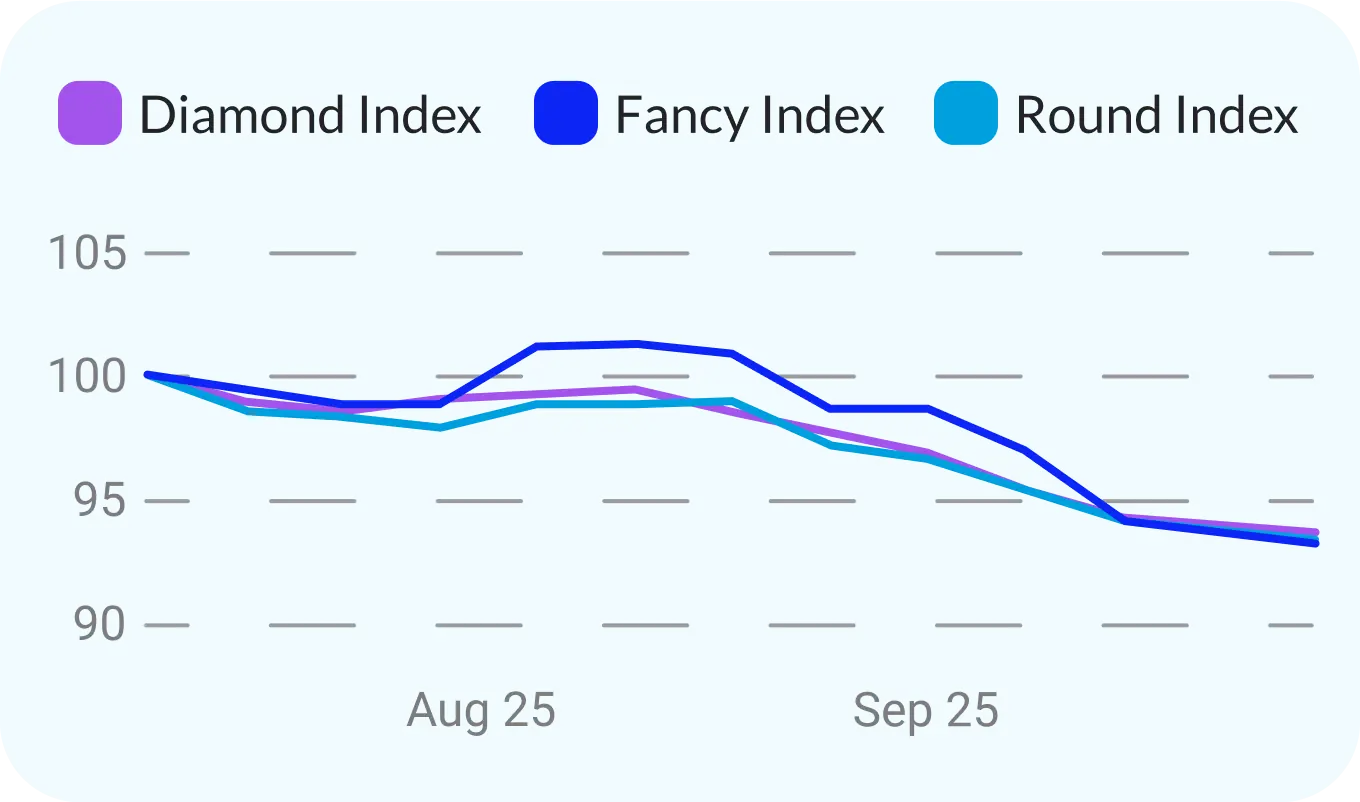
Q3 2025 marked a decisive shift in the diamond market, moving from stability in the first half of the year to a sharper correction. The Diamond Index fell 5.23% in the quarter, bringing the year-to-date decline to 9.24%, a clear acceleration from the modest 3.4% drop recorded at the end of Q2. The introduction of higher U.S. tariffs (50%) on Indian polished goods in late August was the key driver, pushing prices lower into September and reshaping sourcing patterns across major trading hubs.
Rounds absorbed the bulk of the adjustment. The hardest hit were 1ct goods and below, with both 0.30ct and 0.50ct goods showing double-digit price declines across clarity groups. The 1ct segment, which had seen only limited weakness earlier in the year, lost further ground in Q3 as supply rose and prices dropped more sharply than in Q2. This shift shows how quickly mid-range goods can be pulled into broader market pressure once external costs rise and supply expands. By contrast, 2ct stones remained one of the most stable categories in the market, with prices essentially flat year-to-date and higher-color VS goods even showing gains. At the larger end, 3ct VS+ goods held firm with only a marginal slip, while SI weakened further, though Collection D–F SIs stood out with positive movement.
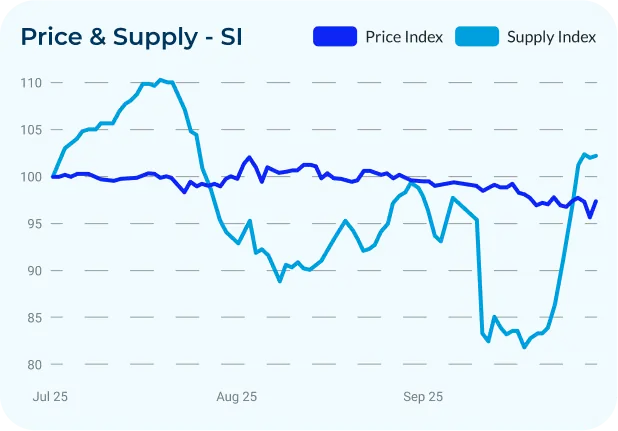
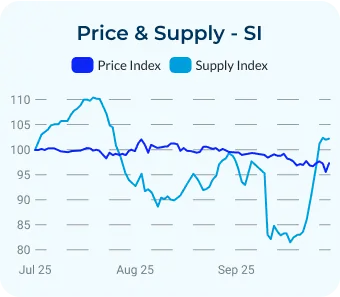
Fancies also came under pressure, falling 5.54% during the quarter, yet they remain comparatively more resilient on a year-to-date basis with only a 3.72% decline. This reversed the 0.5% increase recorded in Q2, shifting the Fancy Index from +1.6% year to date at end-Q2 to -3.72% at end-Q3. Prices stepped down in the back half of the quarter following the late-August tariff changes, consistent with the broader September reset observed across indices.
Overall, Q3 was less about volatility and more about redistribution of pressure. Smaller stones bore the sharpest declines, mid-sized 1ct goods followed them lower, and larger stones again proved steadier, creating a market that is splitting more clearly by size and clarity. Looking to Q4’s holiday season, sentiment is cautious but engaged, with many in the trade expecting steadier sell-through and watching pricing closely under the new tariff backdrop.
As the market adapts to this new environment, UNI Diamonds’ analytics remain critical for understanding pricing shifts, monitoring clarity and size-specific trends, and navigating a trade landscape that is now more fragmented and selective than at any point this year.
Overview of the Industry
Diamond Index
The diamond market came under sharper pressure in Q3 2025, with the Diamond Index decreasing by 5.23%. This brings the year-to-date decline to 9.24%, a marked acceleration from the modest 3.4% decrease at the end of Q2. The sharper correction reflects a market now absorbing prolonged tariff uncertainty, especially the August hikes on Indian goods and the competitive shifts they triggered across hubs like Belgium and Israel. Price list reductions in 1ct goods and below also contributed to the weaker performance.
Round Index
The Round Index fell by 5.44% over the quarter, a steeper movement than Q2’s 1.5% decline. The segment was particularly affected by the U.S. tariff environment, as most rounds originate from India and now face a 50% duty. This weighed heavily on sentiment, with American buyers reducing orders and adopting a more cautious stance. Some manufacturers also operated on the view that the tariff regime might be short-lived, which tempered immediate pricing changes even as orders slowed. Year-to-date, the Round Index is now down 10.46%, underscoring the cumulative impact of sustained price pressure, trade disruptions, and price list reductions in smaller sizes through the first nine months of the year.
Fancy Index
The Fancy Index dropped by 5.54% during Q3, reversing the gradual gains seen earlier in 2025. Despite the sharper quarterly movement, Fancies remain the comparatively more resilient segment on a year-to-date basis, with a decline of just 3.72%. Part of this relative strength stems from polished stones of EU origin, which have benefitted since September from the U.S. tariff exemption on polished goods that have been manufactured in the EU, providing buyers with a competitive alternative to heavily taxed Indian supply.
Round 0.30ct Stones
In Q3 2025, the 0.30ct segment came under visible pressure, with both clarity groups recording notable price declines.
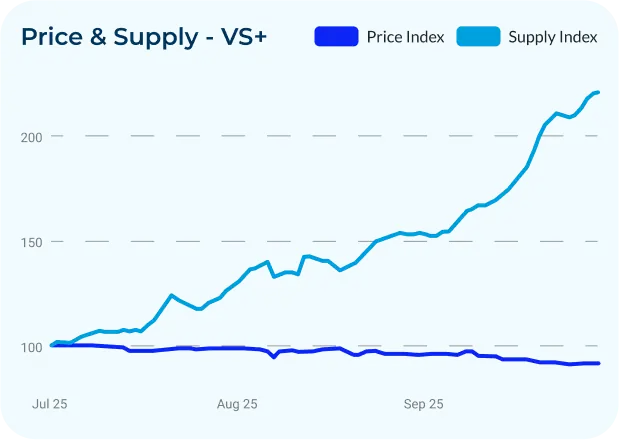
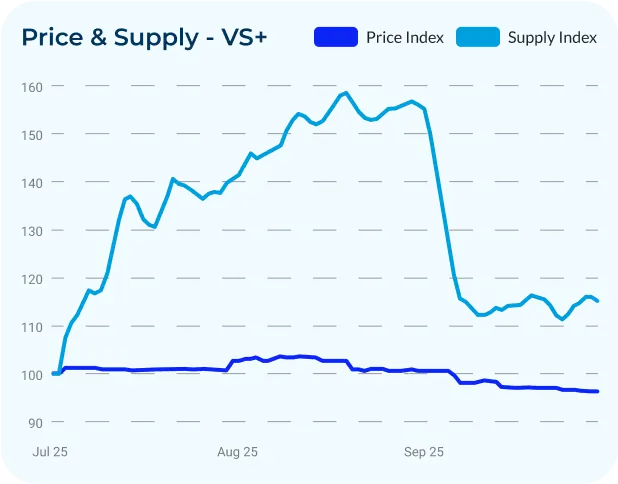
VS+ stones fell by 9% over the quarter. This drop came alongside a significant surge in supply of certified goods, which rose by 120.8%. The sharp increase in availability without corresponding demand placed clear downward pressure on pricing.
SI stones declined by 10.71%, continuing the trend of weakness in smaller goods. Supply of certified goods decreased by 11.8%, indicating some contraction in availability, yet prices still fell as the segment remained sensitive to shifting demand dynamics.
Across colors, Collection (D–F) and Near Colorless (G–I) goods recorded the steepest losses, while Light Color (J–L) goods experienced comparatively smaller declines.
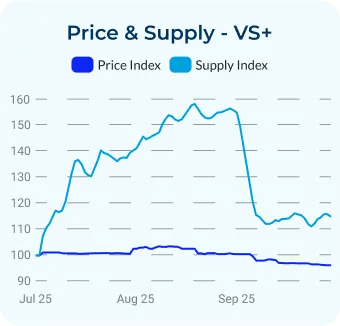
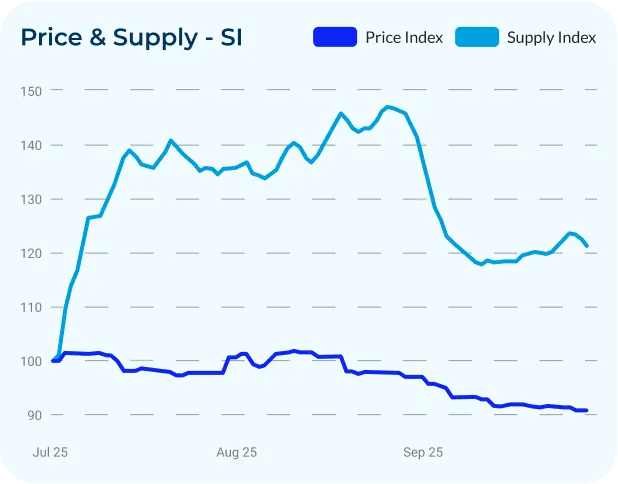
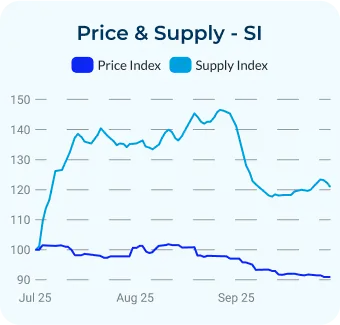
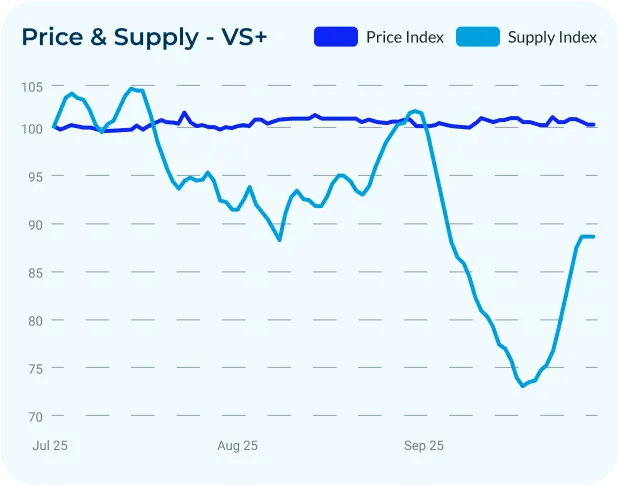
Round 0.50ct Stones
The 0.50ct segment faced sustained pressure in Q3 2025, with both clarity groups showing notable price declines.
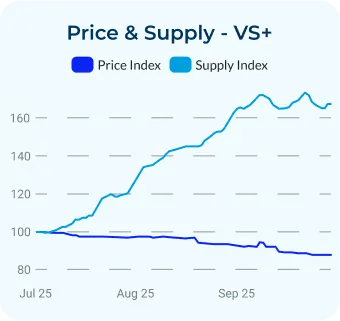
VS+ stones fell by 11.4% during the quarter. Prices decreased consistently from early July, showed a brief pause in mid-August, and then resumed their downward trend into late September. Supply of certified goods rose by 64%, reinforcing the weakness in pricing.
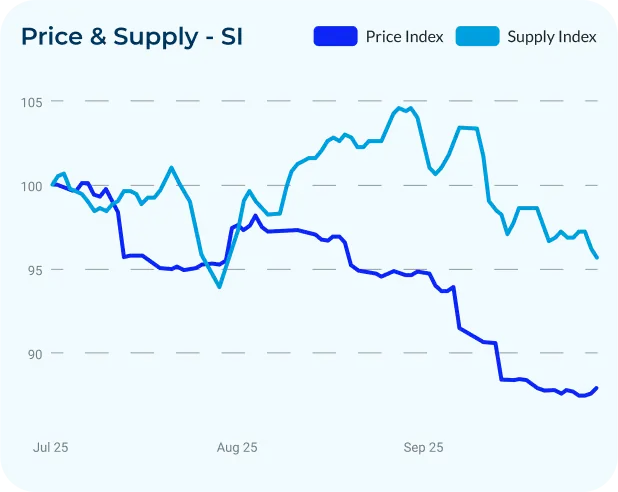
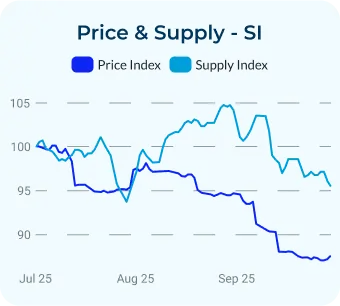
SI stones declined by 12.2%, reflecting continued vulnerability in this category. Prices slid steadily through the quarter, with a more pronounced dip late in September before stabilizing. Supply of certified goods decreased by 4.4%, though the contraction was not enough to support prices.
Round 1ct Stones
The 1ct category ended Q3 2025 weaker than in Q2, with both clarity groups closing lower but following different intra-quarter paths.
VS+ prices declined by 3.8% over the quarter. Prices briefly firmed in August before easing again through September. This is a softer performance than Q2, when VS+ slipped just 1%, and it coincided with a shift in supply from contraction last quarter to a 15.2% increase in Q3. The result mirrors the broader pattern from Q2: higher-quality goods remained relatively more resilient than SI, but they were not immune to renewed pressure.
SI prices fell by 9% for the quarter, a sharper drop than the 3.9% decrease recorded in Q2. Pricing trended lower from July onward without a meaningful rebound, while supply rose 21% after contracting in Q2. Together, these moves reinforce the structural demand weakness in lower-clarity goods that has persisted across consecutive quarters.
Round 2ct Stones
The 2ct category once again demonstrated stability in Q3 2025, with both clarity groups recording only marginal price changes. This marked a continuation of the pattern seen earlier in the year, contrasting with the sharper volatility in smaller sizes.
VS+ prices edged up by 0.25% over the quarter. Prices stayed in a tight range, underscoring the relative resilience of higher-clarity 2ct goods, which have now held steady for three consecutive quarters. In Q2, VS+ prices were flat, and the current uptick, though modest, signals continued firmness in demand. Supply contracted by 11.6% in Q3, after expanding slightly in Q2, which supported price stability.
SI stones also remained steady, with prices decreasing just 1.15% in Q3. This compares to a flat performance in Q2, highlighting that even in the face of persistent weakness in lower-clarity categories overall, 2ct SI goods have avoided the steep declines observed in smaller stones. Supply fell by 11.8% over the quarter, reversing the 6% increase recorded in Q2, which helped cushion prices from broader market softness.
Together, these results show that the 2ct segment has been one of the most stable size categories throughout 2025. Both VS+ and SI prices have been essentially flat year-to-date, supported by tighter supply conditions, and continue to stand in contrast to the more pressured dynamics in 1ct goods and below.
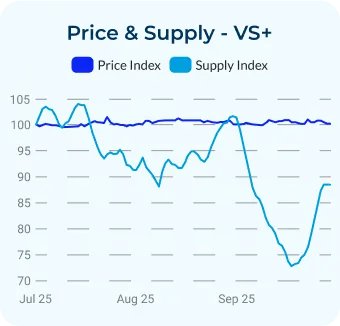
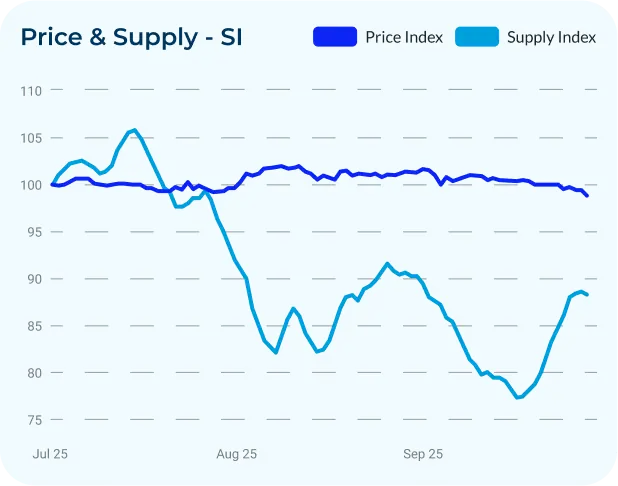
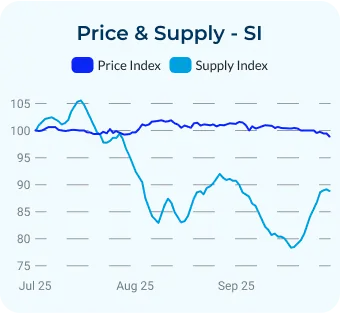
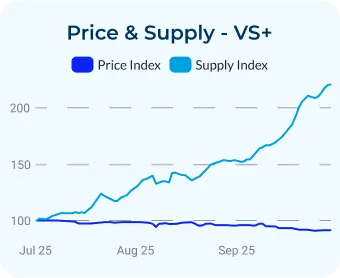
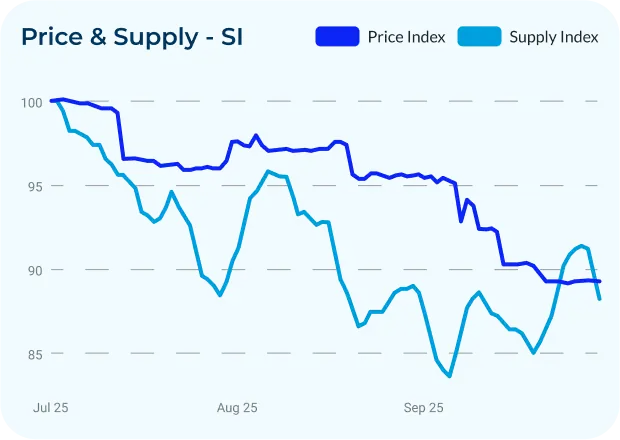
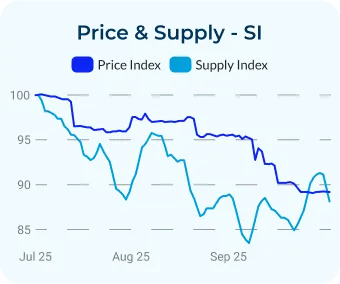
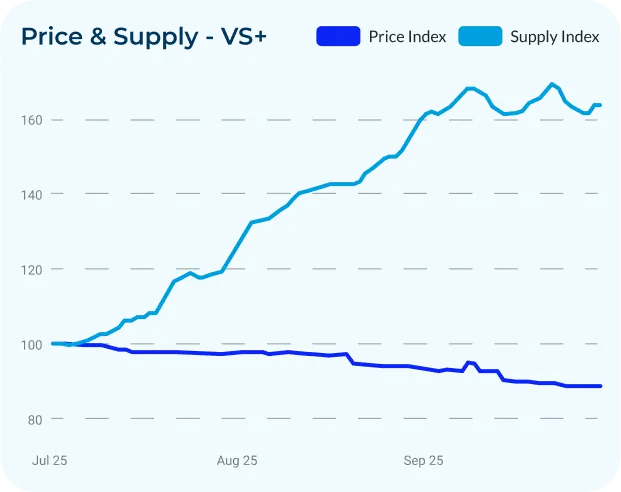
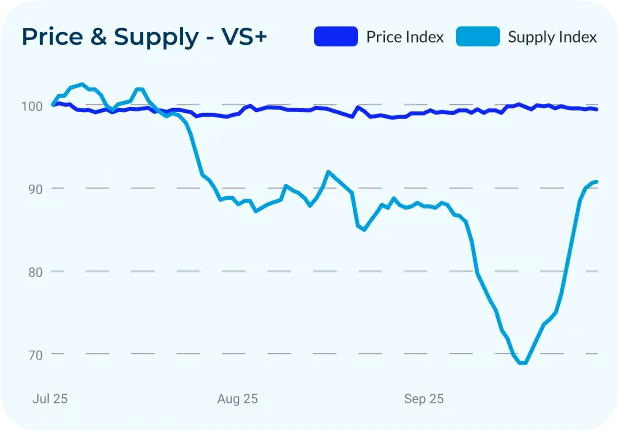
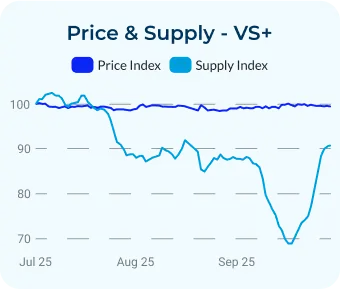
Round 3ct Stones
The 3ct segment showed a split in Q3 2025, with higher-clarity goods holding steady while lower-clarity stones weakened.
VS+ prices remained stable, slipping just 0.62% for the quarter. This is broadly consistent with Q2, when VS+ were down about 1%, and reinforces the steadiness seen at the top end of this size range.
SI prices fell by 2.56% over the quarter, a slightly sharper decline than in Q2 when SI were down about 1%. SI Collection (D–F) goods saw a 2.43% price rise during Q3, highlighting strength in higher-color SI even as broader SI pricing softened.
Key Insights
Tariffs move the market from pause to repricing
Q3 is when tariff risk turned into actual costs. Higher U.S. duties on Indian polished goods took effect in late August, and prices stepped down through September. The change is evident across size groups, with the scale varying by clarity but the direction lower. This marked the first real shift from expectation to impact, showing how quickly sentiment can turn once policy becomes reality. Belgium’s late-quarter exemption is a Q4 factor and may influence sourcing patterns and price spreads next.
Small stones feel it first
The biggest step down came in 0.30cts and 0.50cts. Both VS+ and SI saw the sharpest price moves of the quarter here. In 0.30ct, a surge in VS+ availability lined up with weaker pricing, and SI also fell despite a smaller drop in certified supply. In 0.50ct, prices trended lower across the quarter for both clarity groups. Taken together, 1ct goods and below absorbed most of Q3’s adjustment, with SI underperforming VS+.
1ct stones lose ground
The 1ct category weakened further in Q3. VS+ prices declined 3.8% after a smaller 1% drop in Q2, while SI fell 9% compared with a 3.9% fall last quarter. A brief lift in August proved short-lived, with September marking a clear downward reset. The shift in supply from contraction in Q2 to a 15.2% increase in Q3 added pressure, leaving 1ct stones more exposed to the same market headwinds weighing on smaller goods. This marks a clear shift from Q2 conditions and shows that mid-range categories can be exposed when supply expands into tariff-driven weakness.
2ct is the stabilizer buyers rely on
Prices were broadly unchanged in Q3, with VS+ up 0.25% and SI down 1.15%, similar to Q2 when VS+ was flat and SI fell 1.8%. Within VS, D–F increased 2.86% quarter over quarter while G–I edged lower by about 1.1%. Supply moved lower across both clarity groups, keeping prices in a tight range. Taken together, 2ct remained a stable part of the market, the gap between VS+ and SI did not widen, higher color inside VS drew relatively stronger interest than mid color, and steady pricing in this size helped limit the broader index decline during the Q3 reset. The consistency here reinforces 2ct as the market’s anchor: despite wider disruption, buyers continue to treat this size as reliable, supporting demand even under pressure.
3ct market splits by clarity
Large rounds split by clarity. VS+ held its ground with only a minor slip, decreasing just 0.62% in Q3, while SI stepped down with a 5% decline. Even inside SI, higher-color pockets found support and outperformed broader SI pricing, with Collection D–F rising 2.43%. This pattern indicates firmer relative demand for higher-color profiles within SI while broader SI pricing softened. This divergence highlights how selective demand has become: in larger goods, buyers are willing to pay up for strong quality signals, while lower-clarity goods lose ground.
Sourcing stateside emerges as an option
Despite tariff-driven disruption, U.S.-located inventory remains available in meaningful volumes on UNI’s platform from 140+ suppliers. This creates a path to purchase without new import duties and with shorter lead times, making U.S.-located goods a practical buffer while international trade terms are in flux.
Use UNI Diamonds’ data-driven tools to monitor these evolving patterns, adjust your pricing and inventory strategies, and stay competitive in a market that’s showing signs of renewed balance.
Conclusion
Q3 2025 underscored the growing impact of tariffs on the global diamond trade. The sharp step-down in prices across rounds, especially in smaller goods, highlighted how quickly the market can reprice when costs shift. At the same time, the steadiness of 2ct stones and the relative resilience of higher-color 3ct goods show that selective strength still exists, even in a pressured environment.
The quarter closed with the market more divided than at any point this year: 1ct goods and below reset lower, and larger categories continued to provide stability. With Belgium’s exemption of polished goods manufactured in the EU only beginning to factor in at the end of Q3, its full influence will be seen in Q4, alongside continued adjustments in India and Israel.
The market now enters the final quarter of the year with greater caution but also clearer signposts. Pricing has recalibrated, supply dynamics are shifting, and demand is fragmenting more distinctly by size and clarity. These conditions will define trading strategies in the months ahead, making reliable, real-time insights essential for navigating what comes next.
Ready to Elevate Your Diamond Trading?
Leave your details to book a demo and one of our representatives will get back to you as soon as possible!